3 Experiments and Results
We organise eleven platform experiments and six card-tournament sweeps around four research questions: the fragility threshold (RQ1), structural asymmetries and institutional limits (RQ1–RQ2), the epistemic dilemma (RQ2–RQ3), and temporal dynamics (RQ4). Each question is examined on both substrates — the deterministic Arena and the stochastic, discrete Forest of Humbaba — and the two are reported together under the research question they address rather than in separate per-instrument blocks. The findings reported below are offered as demonstrations of the laboratory’s generative capacity rather than as claims about any single real-world system. Run counts, metrics, and statistical procedures are described in Section 3.1; all code and card assets are available at gitlab.com/bdpd/bdpd.
The map below shows which sweep addresses which question, and on which substrate:
| Cluster | Substrate | Research question | Theme |
|---|---|---|---|
| P1-P5 (+B1 at P1, B3 at P2) | Arena | RQ1 | discontinuous collapse threshold |
| CT1 | Humbaba | RQ1 | probabilistic collapse matrix |
| CT2 | Humbaba | RQ1 | game-length horizon |
| P6, P7 | Arena | RQ1-RQ2 | endowment and turn-order limits |
| P8 (+B2) | Arena | RQ2 | reactive-inferiority effect |
| P9 | Arena | RQ3 | observation noise as selective blunter |
| CT3 | Humbaba | RQ3 | structural null for random-selection agents |
| P10, P11 | Arena | RQ4 | regen shock and Mule late defection |
| CT4, CT5 | Humbaba | RQ4 | safe betrayal and Stranger-King deep dive |
| CT6 | Humbaba | RQ4 | LLM awareness-without-restraint |
A note on terminology. Throughout this section we use heuristic as shorthand for non-LLM agents on both substrates. In the Arena it denotes the programmed built-in strategies of §2.1 (AggressiveAgent, ConservativeAgent, AdaptiveAgent, RCPAgent, RandomAgent), each implementing an explicit decision rule on the observation. In the card game it covers the demo-mode RandomClient of §2.2 — a degenerate heuristic that picks uniformly at random from the legally playable cards — with archetypal behaviour emerging entirely from deck composition. The LLM-vs-heuristic contrast in CT6 and Appendix B reflects this broader sense.
3.1 Experimental Protocol
The two instruments generate different types of evidence and require different experimental designs. Platform sweeps can enumerate a large parameter space exhaustively, producing binary outcomes (gate pass / collapse) with near-zero variance in regions far from the phase boundary. Card tournaments involve higher stochastic variance — from the Forest Die, card shuffle, and LLM non-determinism — and therefore require more runs per cell and confidence interval reporting. The following sections detail the run counts, metrics, and reproducibility measures common to both.
3.1.1 Run Counts and Statistical Approach
All platform experiments reported here were conducted on BDPD v0.4.1 (repository: gitlab.com/bdpd/bdpd); card simulations used the Humbaba Python engine included in the same repository. The platform codebase has since been extended to v0.5.1, which adds a pluggable engine registry and Seneca ODE support (see Section A.1); all experiments in this paper use the logistic engine and are fully reproducible with either version. Platform sweeps (P1–P11) use 10–30 runs per parameter cell (the fine-grid supplements B1 and B3 use as few as 5; card tournaments use 200 — see below), so the per-cell count across the study spans 5–200. For experiments where outcomes are near-binary (e.g., gate pass rate = 0% or 100% with zero inter-run variance), this is sufficient to establish the threshold region. Card tournaments (CT1–CT5) use 200 games per cell, reflecting the higher stochastic variance introduced by the Forest Die and card shuffle. LLM case studies (CT6) are qualitative analyses, reported as preliminary.
All card tournament metrics report 95% bootstrap confidence intervals (10,000 resamples). Platform sweep metrics are reported as means; where variance is non-trivial (e.g., welfare score near threshold boundaries), \(\pm 1\sigma\) bands are shown.
3.1.2 Metrics
Three primary metrics are tracked:
- Gate pass rate (platform) / Collapse rate (cards): the fraction of runs where the commons survives to the final turn. A binary outcome per run.
- Welfare score: defined as \((1 - G) \times \bar{w}\), where \(G\) is the Gini coefficient and \(\bar{w}\) is mean wealth, introduced in §2 as a Sen-type aggregate balancing collective efficiency and equality.
- Gini coefficient: standard measure of wealth inequality across agents at the final turn.
We also refer throughout to the commons ratio \(\rho = S_t / K\) — the visible stock as a fraction of carrying capacity — which several figures report and on which the conservative and adaptive heuristics condition their harvest (§2.1).
3.1.3 Reproducibility
All experiments are deterministic given a seed. The BDPD platform and card simulator are open-source (Node.js and Python respectively). Configuration files for all reported experiments are included in the repository while raw output JSONs are available upon reasonable request.
3.2 The Fragility Threshold: Discontinuous Collapse (RQ1)
Our first objective was to determine the tolerance of the commons to defection. Is the collapse threshold relative — meaning a system can absorb a small fraction of defectors — or is it discontinuous (Santos and Pacheco 2011; Scheffer 2009), where even a single aggressive agent is sufficient to doom the system? The following five experiments address this question through progressively complex sweeps of agent composition and environmental parameters.
P1 — Aggressive fraction sweep. We swept the number of aggressive agents from 0 to 6 in a fixed 6-agent pool (r = 0.12, K = 150, maxTurns = 60, 10 runs per point). All remaining agents used the conservative strategy. The experiment targets the critical fraction at which the commons transitions from sustainable to collapsing, and measures the concomitant changes in game length, Gini coefficient, and welfare score.
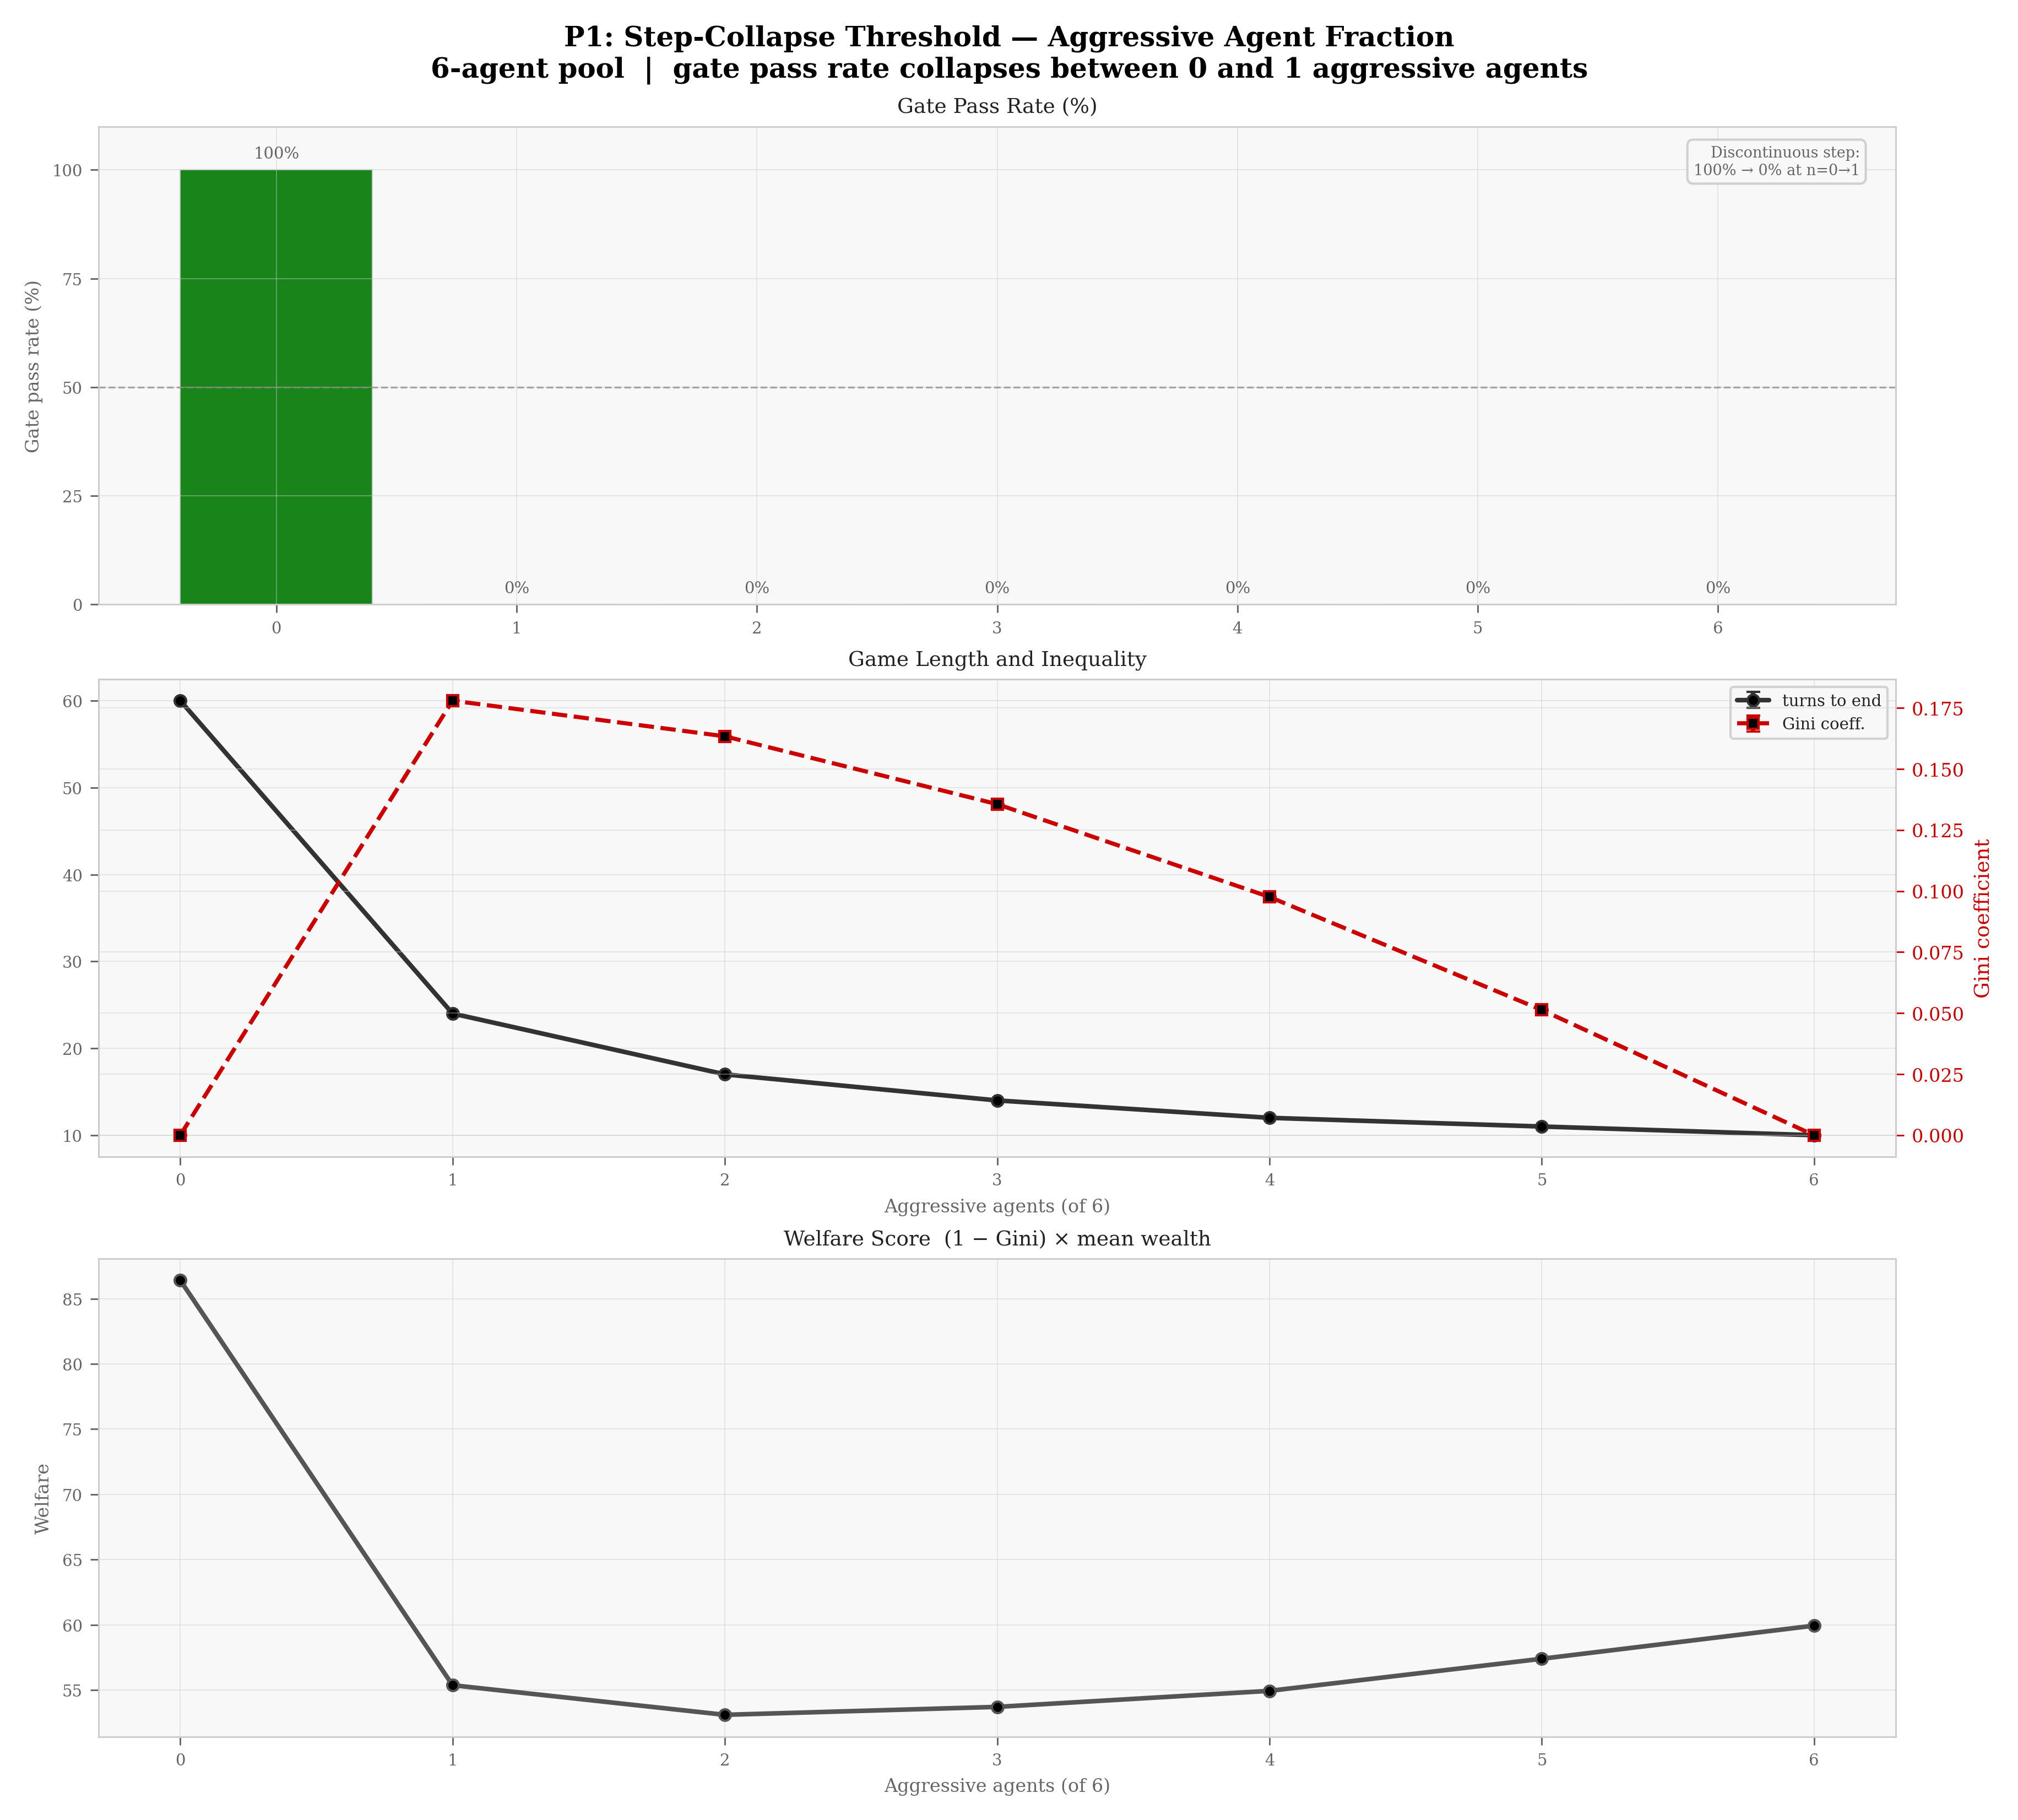
The gate pass rate drops from 100% to 0% with the introduction of a single aggressive agent and remains at 0% for all subsequent compositions (Figure 3.1). Game length falls from ~60 turns to ~24 turns at n = 1, then continues to decline monotonically to ~10 turns at n = 6 — more aggressive agents accelerate depletion as aggregate extraction grows with each additional defector. The Gini coefficient peaks at n = 1 (Gini = 0.178), when the single aggressive agent maximises its wealth differential against five conservatives, then declines monotonically as all agents converge to the same strategy. Welfare steps down sharply with the first defector (from ~86 to ~55) and then stays roughly flat, mirroring the gate’s discontinuity at n = 1 without itself falling to zero. Supplement B1 (Appendix B) localises the cliff edge at aggressor intensity \(i \approx 0.05\)–\(0.06\) (95% bootstrap CI [0.04, 0.05], 10000 iterations): the canonical heuristic (\(i = 0.5\)) sits nearly an order of magnitude above this threshold, confirming that the step-collapse observed here is not an artefact of an extreme parametrisation (Figure 3.2).
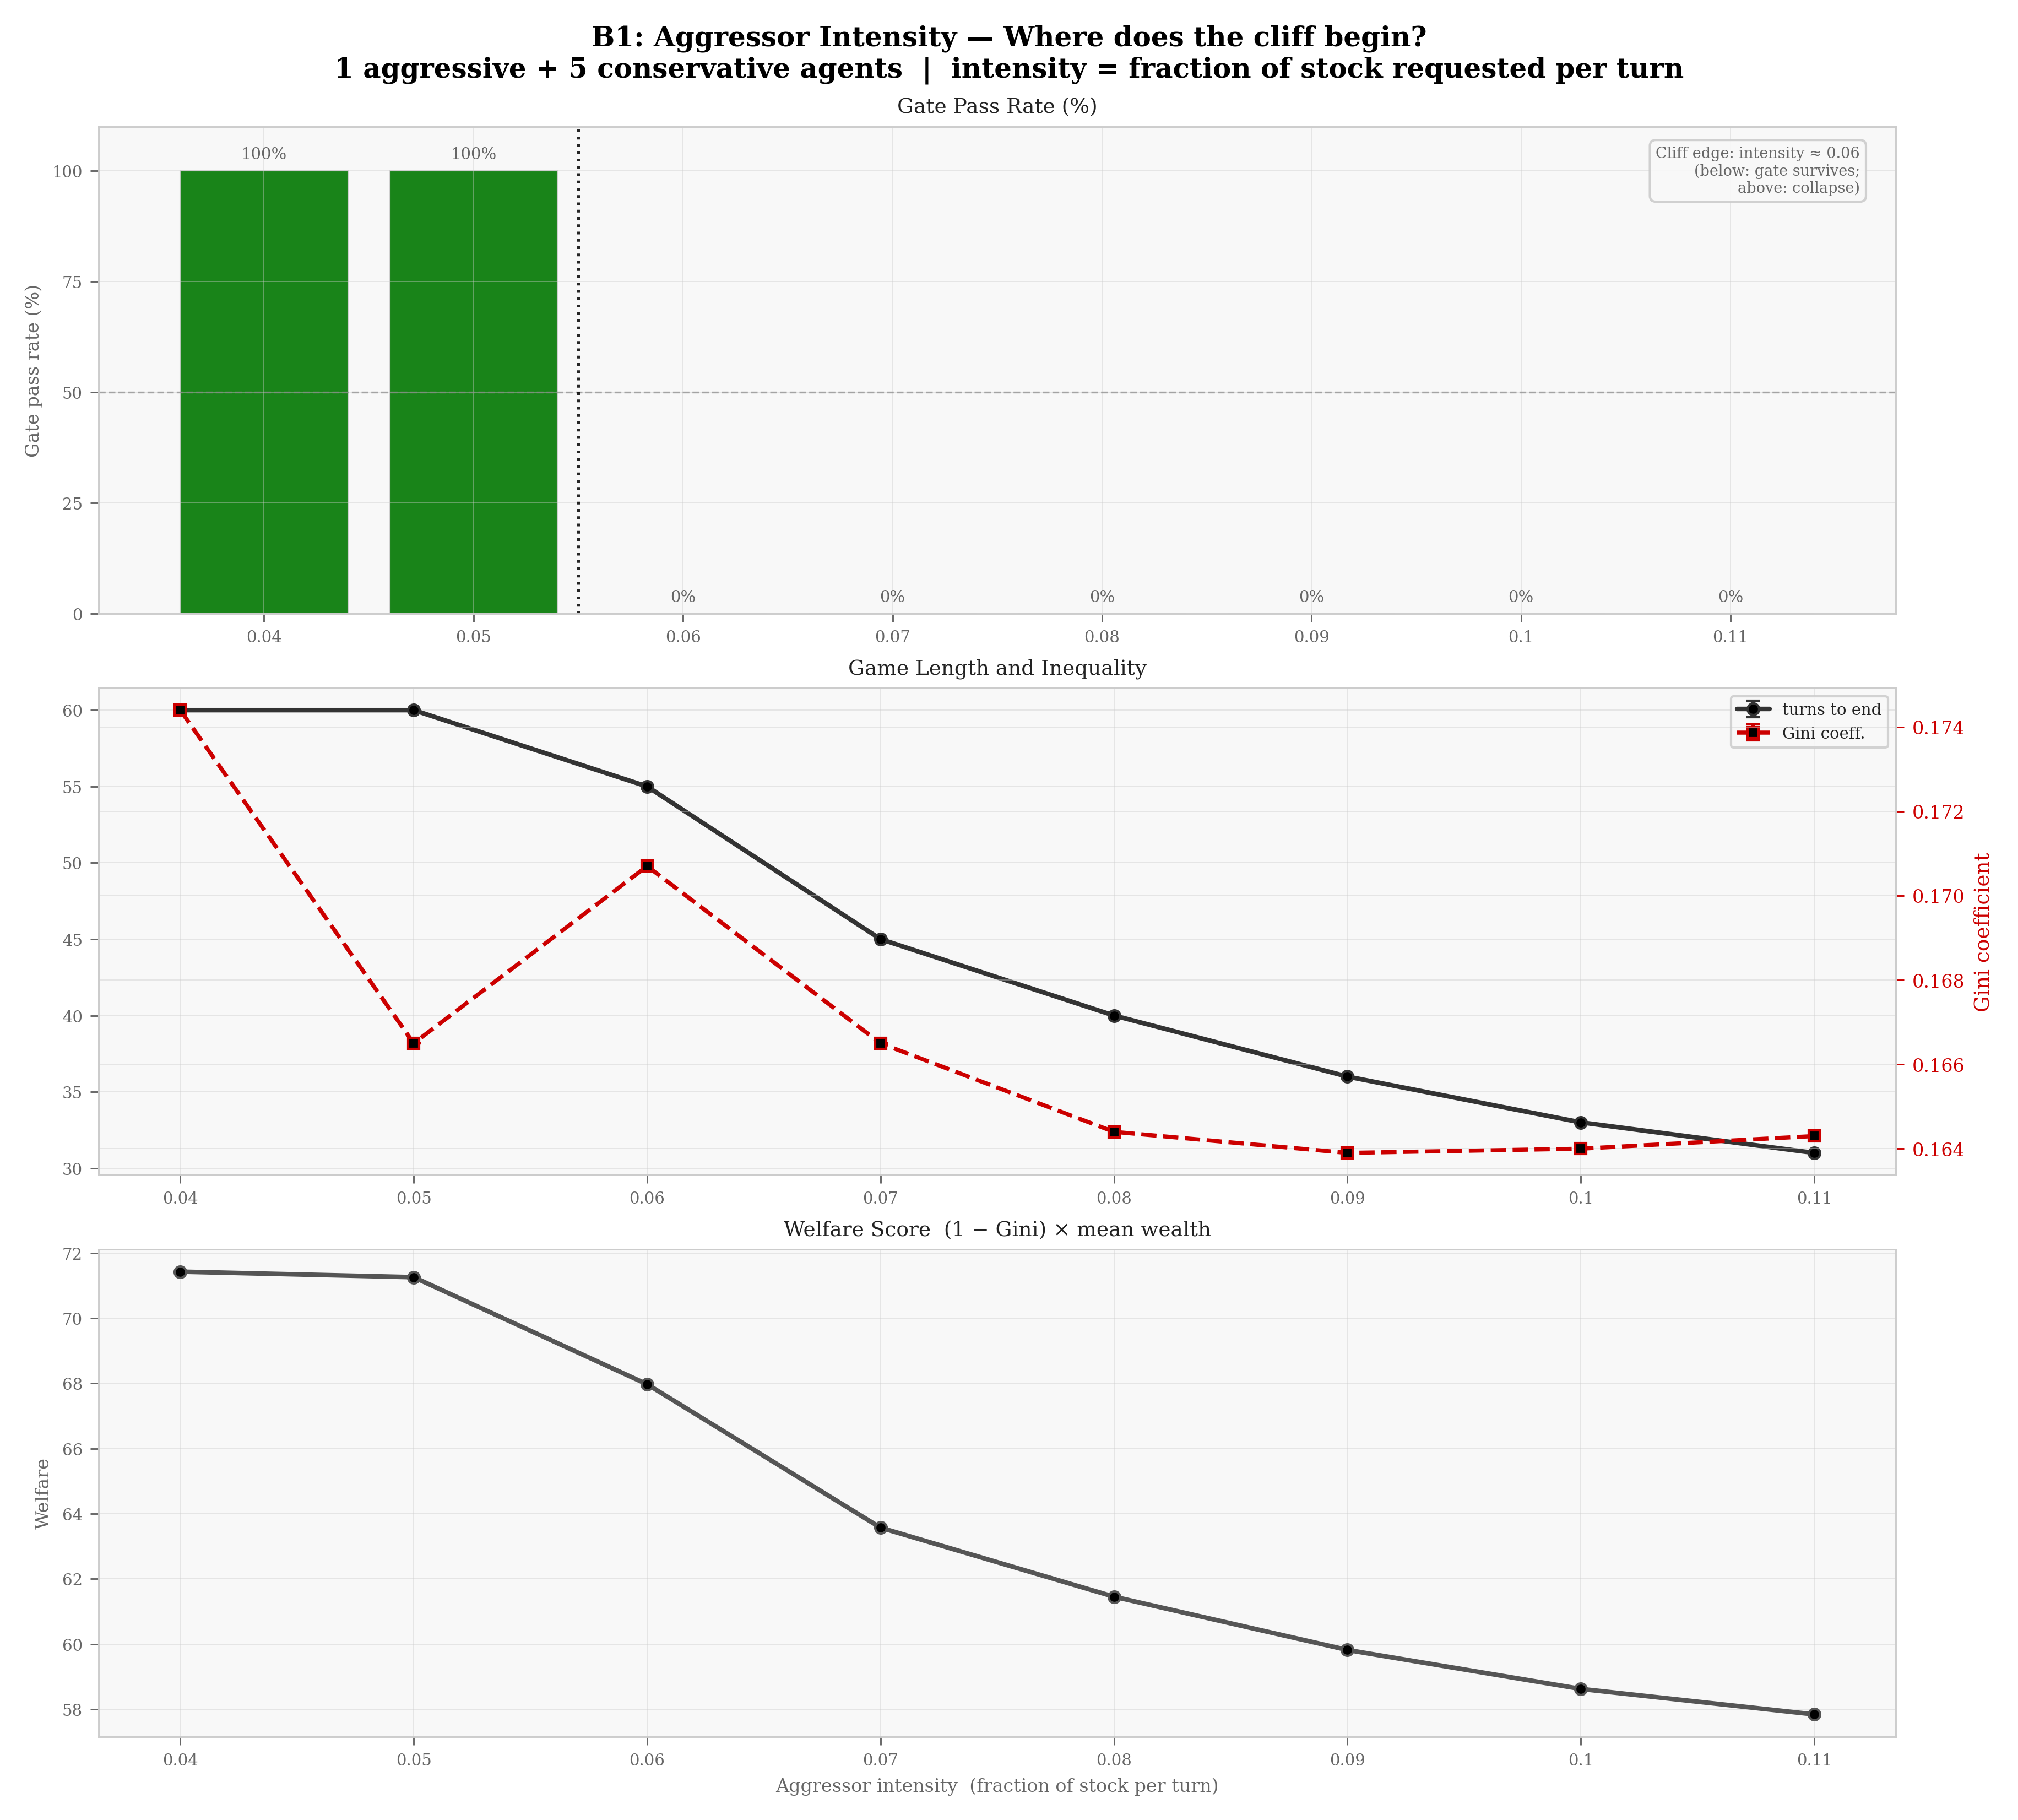
In other words, even an aggressor extracting only 6% of visible stock per turn — a rate that would not ordinarily be labelled aggressive — is sufficient to doom the commons. The default heuristic (\(i = 0.5\)) sits roughly ten times above this threshold, which means the result of P1 is not sensitive to the choice of parameter: the step-collapse is a structural property of agent-type composition, not a consequence of having chosen an extreme value.
P2 — Regen rate sweep. We swept the regeneration rate r from 0.04 to 0.32 in a mixed 4-agent population (1 aggressive + 2 conservative + 1 reactive). The hypothesis was that a sufficiently high regen rate might allow the commons to recover from aggressive extraction and eventually sustain cooperative outcomes. The experiment tests whether regen rate constitutes a bifurcation parameter for gate passage.
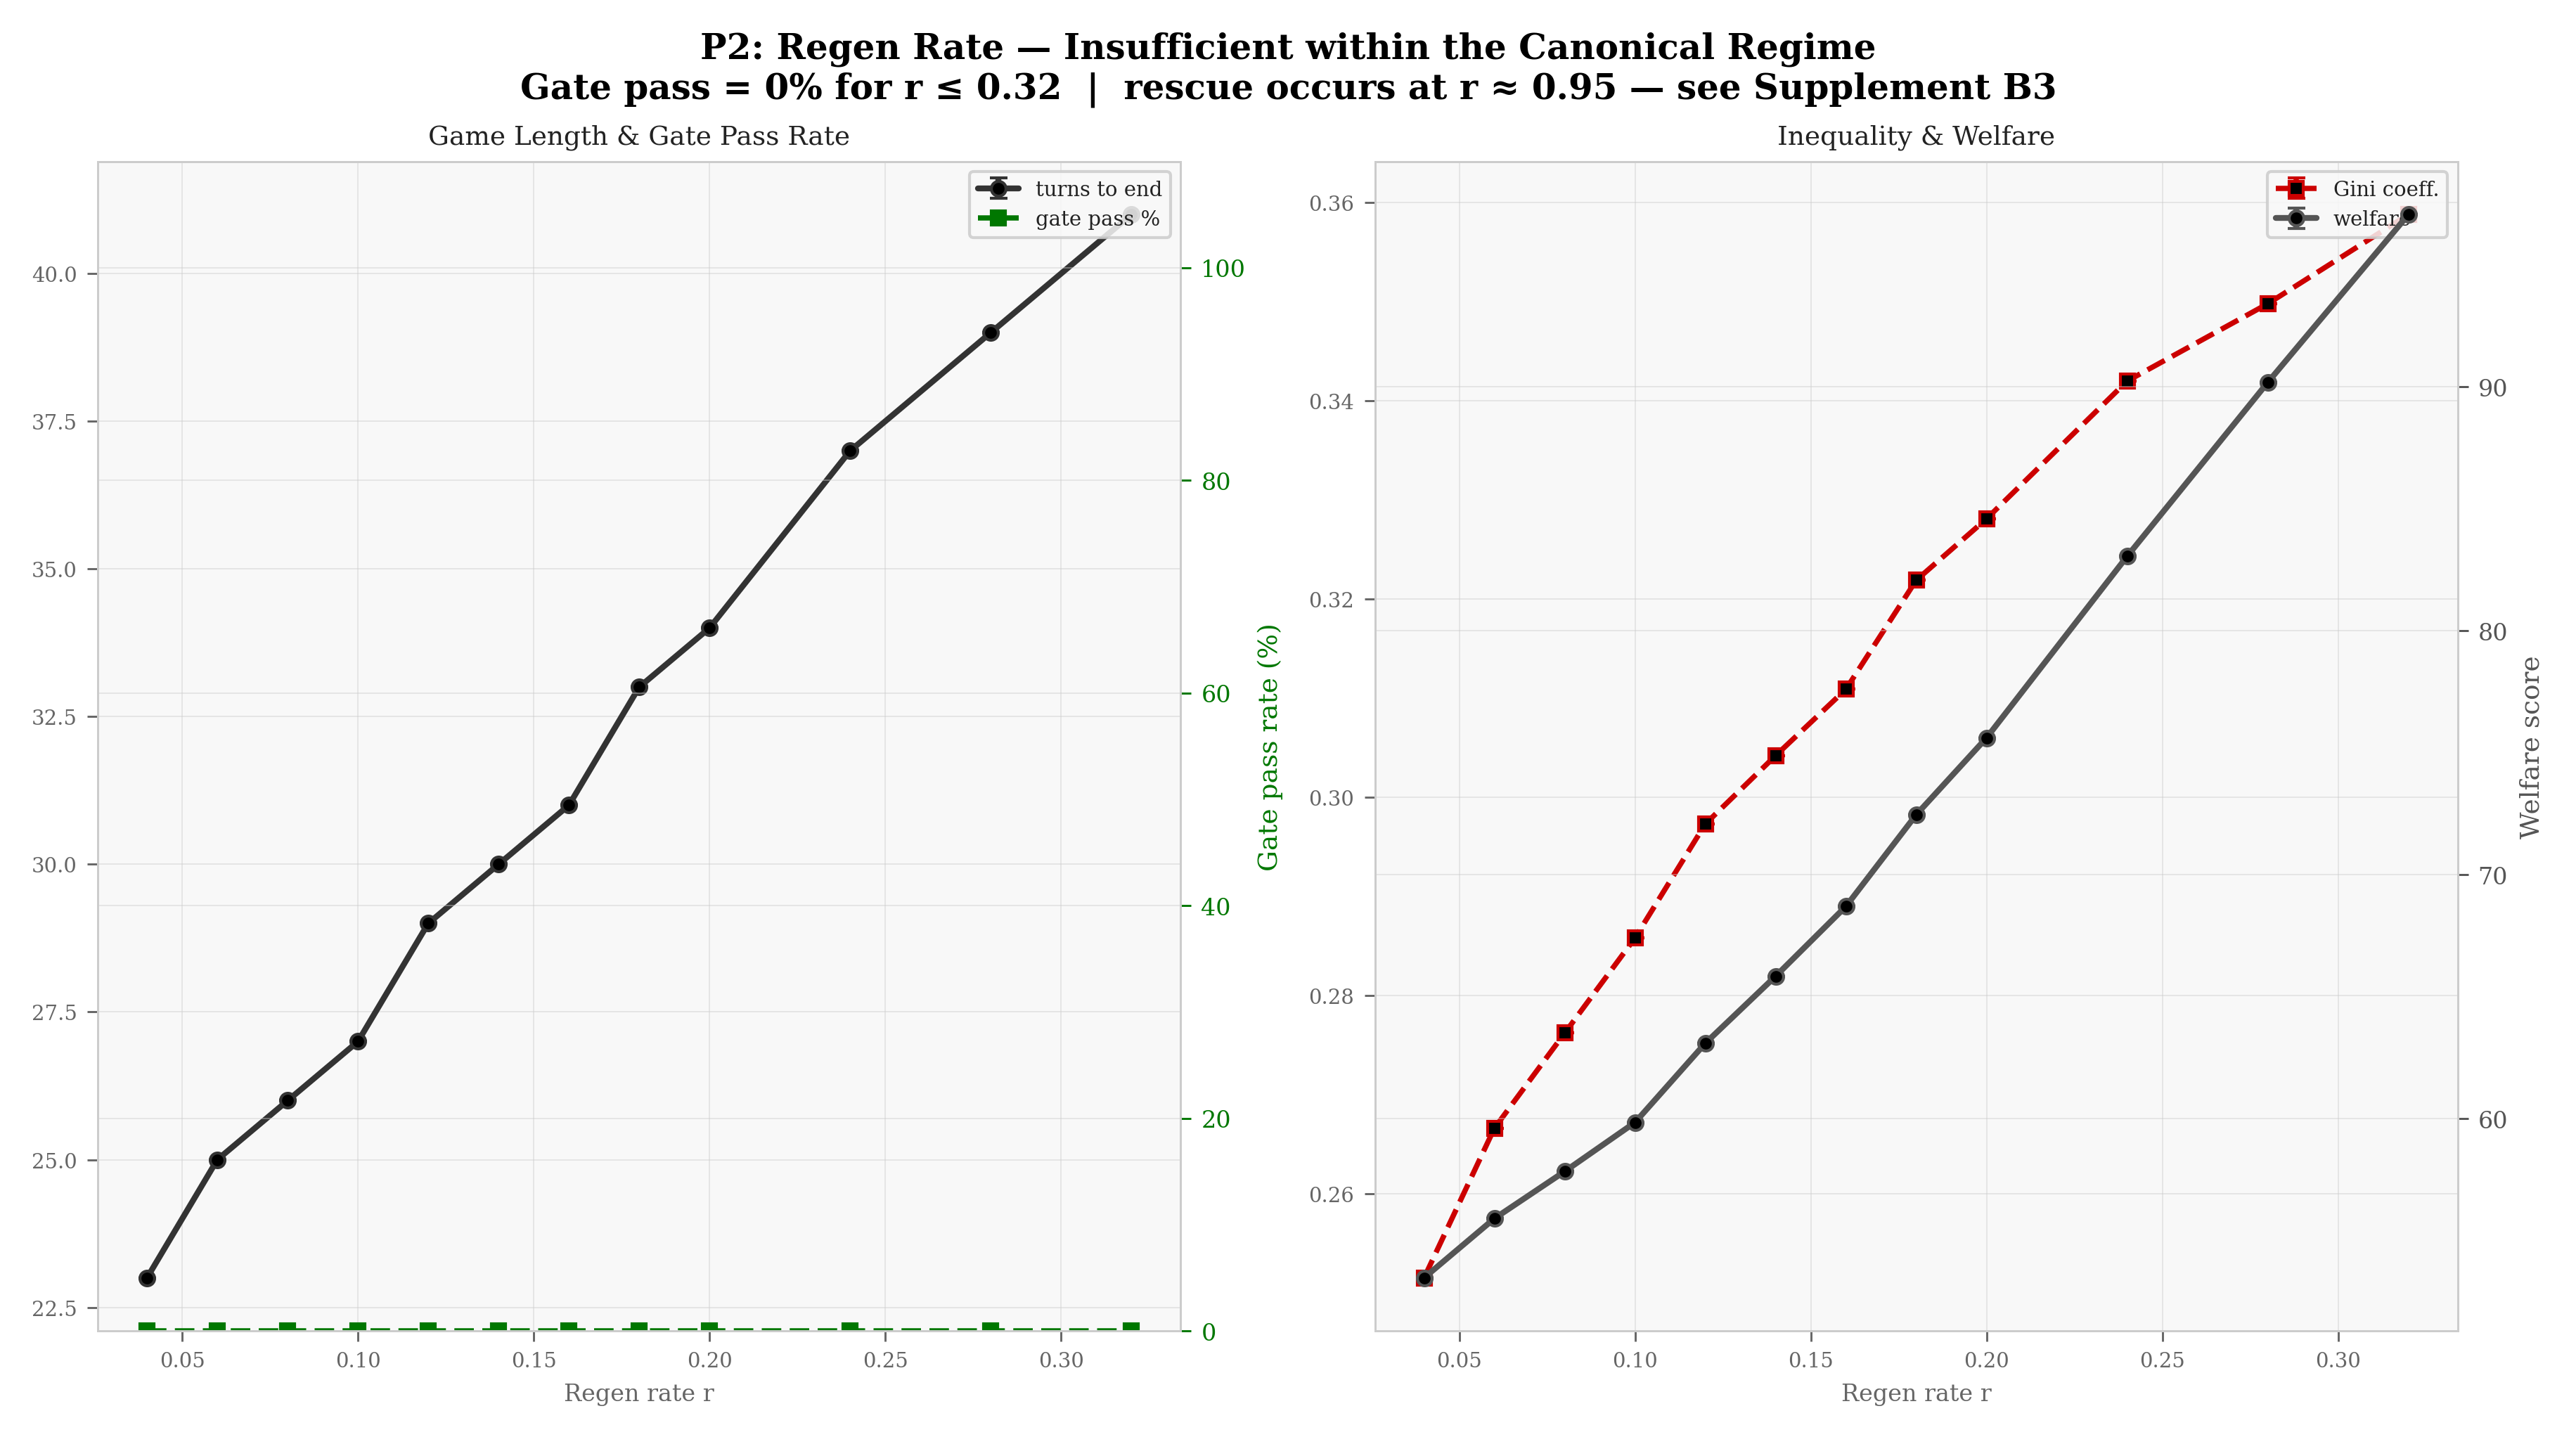
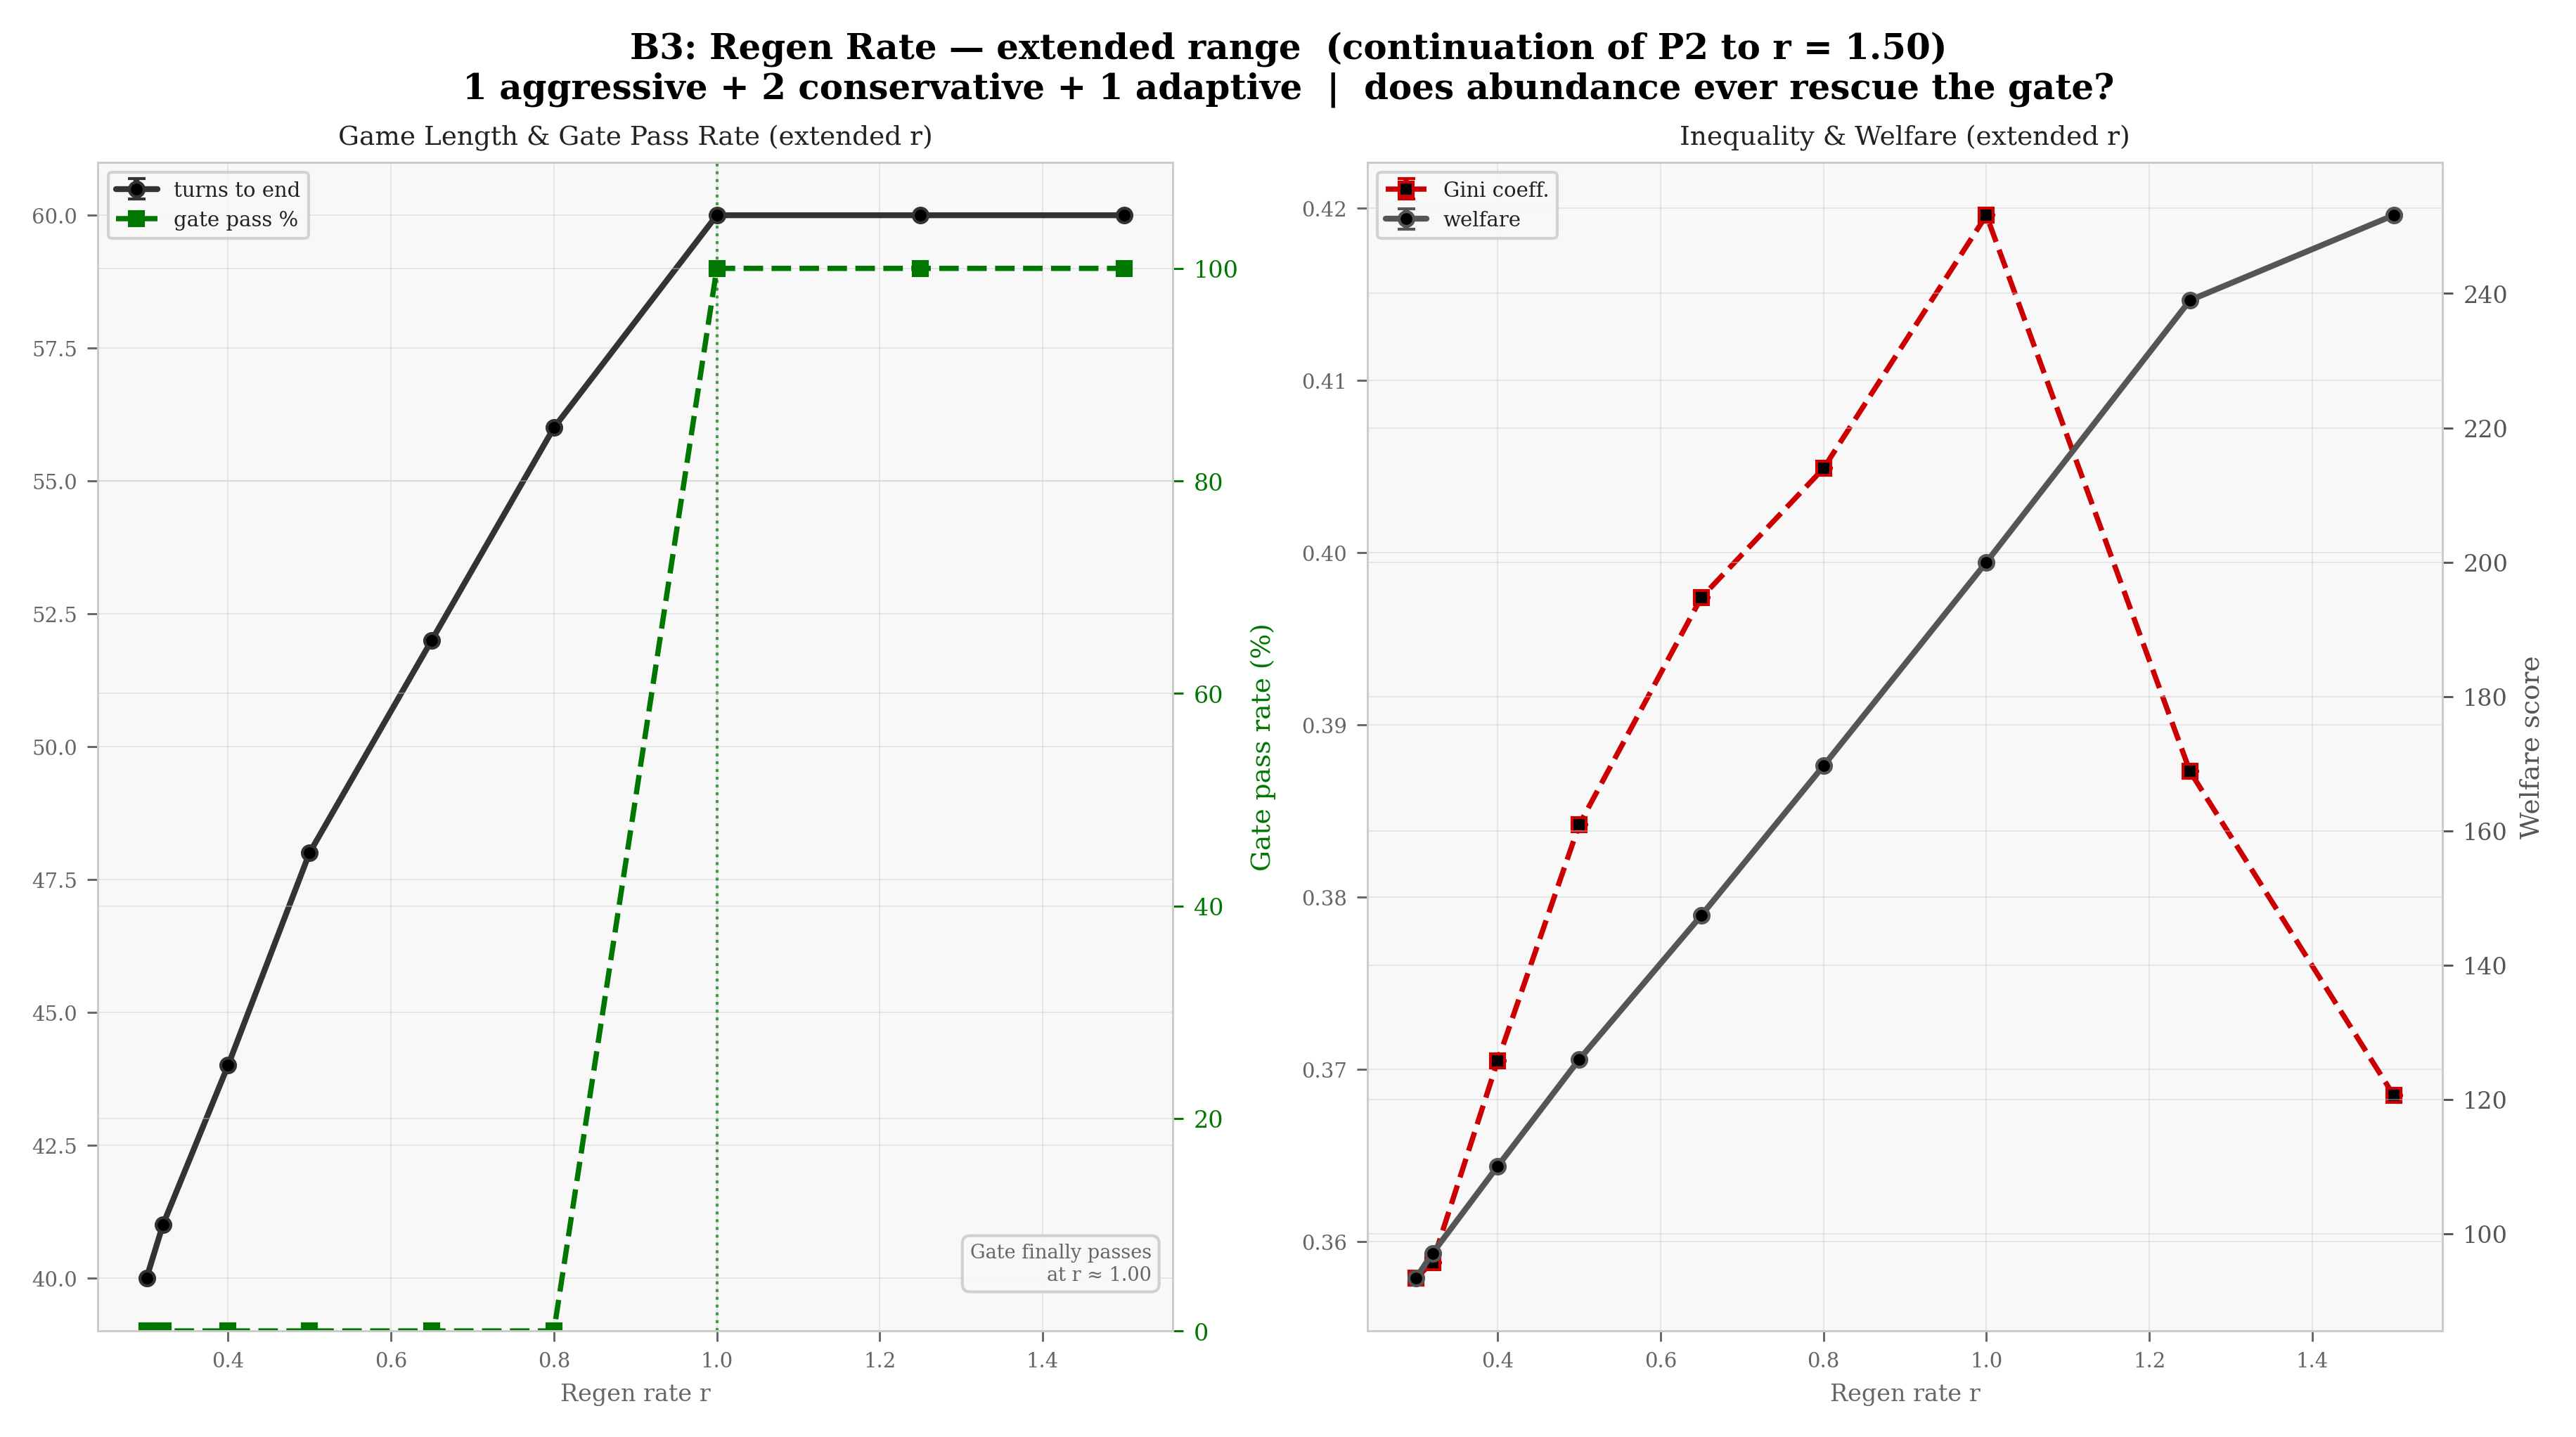
No level of natural regeneration offsets the extraction pressure of a single aggressive agent within the tested range (Figure 3.3). Game length increases monotonically with r (from ~23 to ~41 turns) — higher regeneration delays depletion without preventing it. The Gini coefficient rises with r because longer games give the aggressive agent more turns to compound its advantage. Within the canonical range (\(r \in [0.04, 0.32]\)), regen rate does not constitute a bifurcation parameter. Supplement B3 (Appendix B) extends this sweep to r = 1.50: gate passage first occurs at \(r \approx 0.95\) (95% bootstrap CI [0.95, 1.025]), where regenerative capacity matches the scale of combined extraction. This boundary lies nearly 3\(\times\) above the canonical range (\(0.95/0.32 \approx 3\)); throughout the slow-regeneration regime (\(r \leq 0.32\)) characteristic of real common-pool resources, the presence of a single aggressive agent is a sufficient condition for collapse (Figure 3.4).
P3 — Pool size scaling. We tested 1 aggressive agent in pools of N = 2, 4, 6, 8, 12 agents (r = 0.12, all others conservative, 20–30 runs per point). If the collapse threshold were proportional (1/N), larger pools would dilute the aggressive agent’s impact and gate pass rates would be stable. If the threshold is discontinuous, larger pools should not help — and may actively accelerate collapse by providing more conservative agents whose harvests sum to greater total extraction.
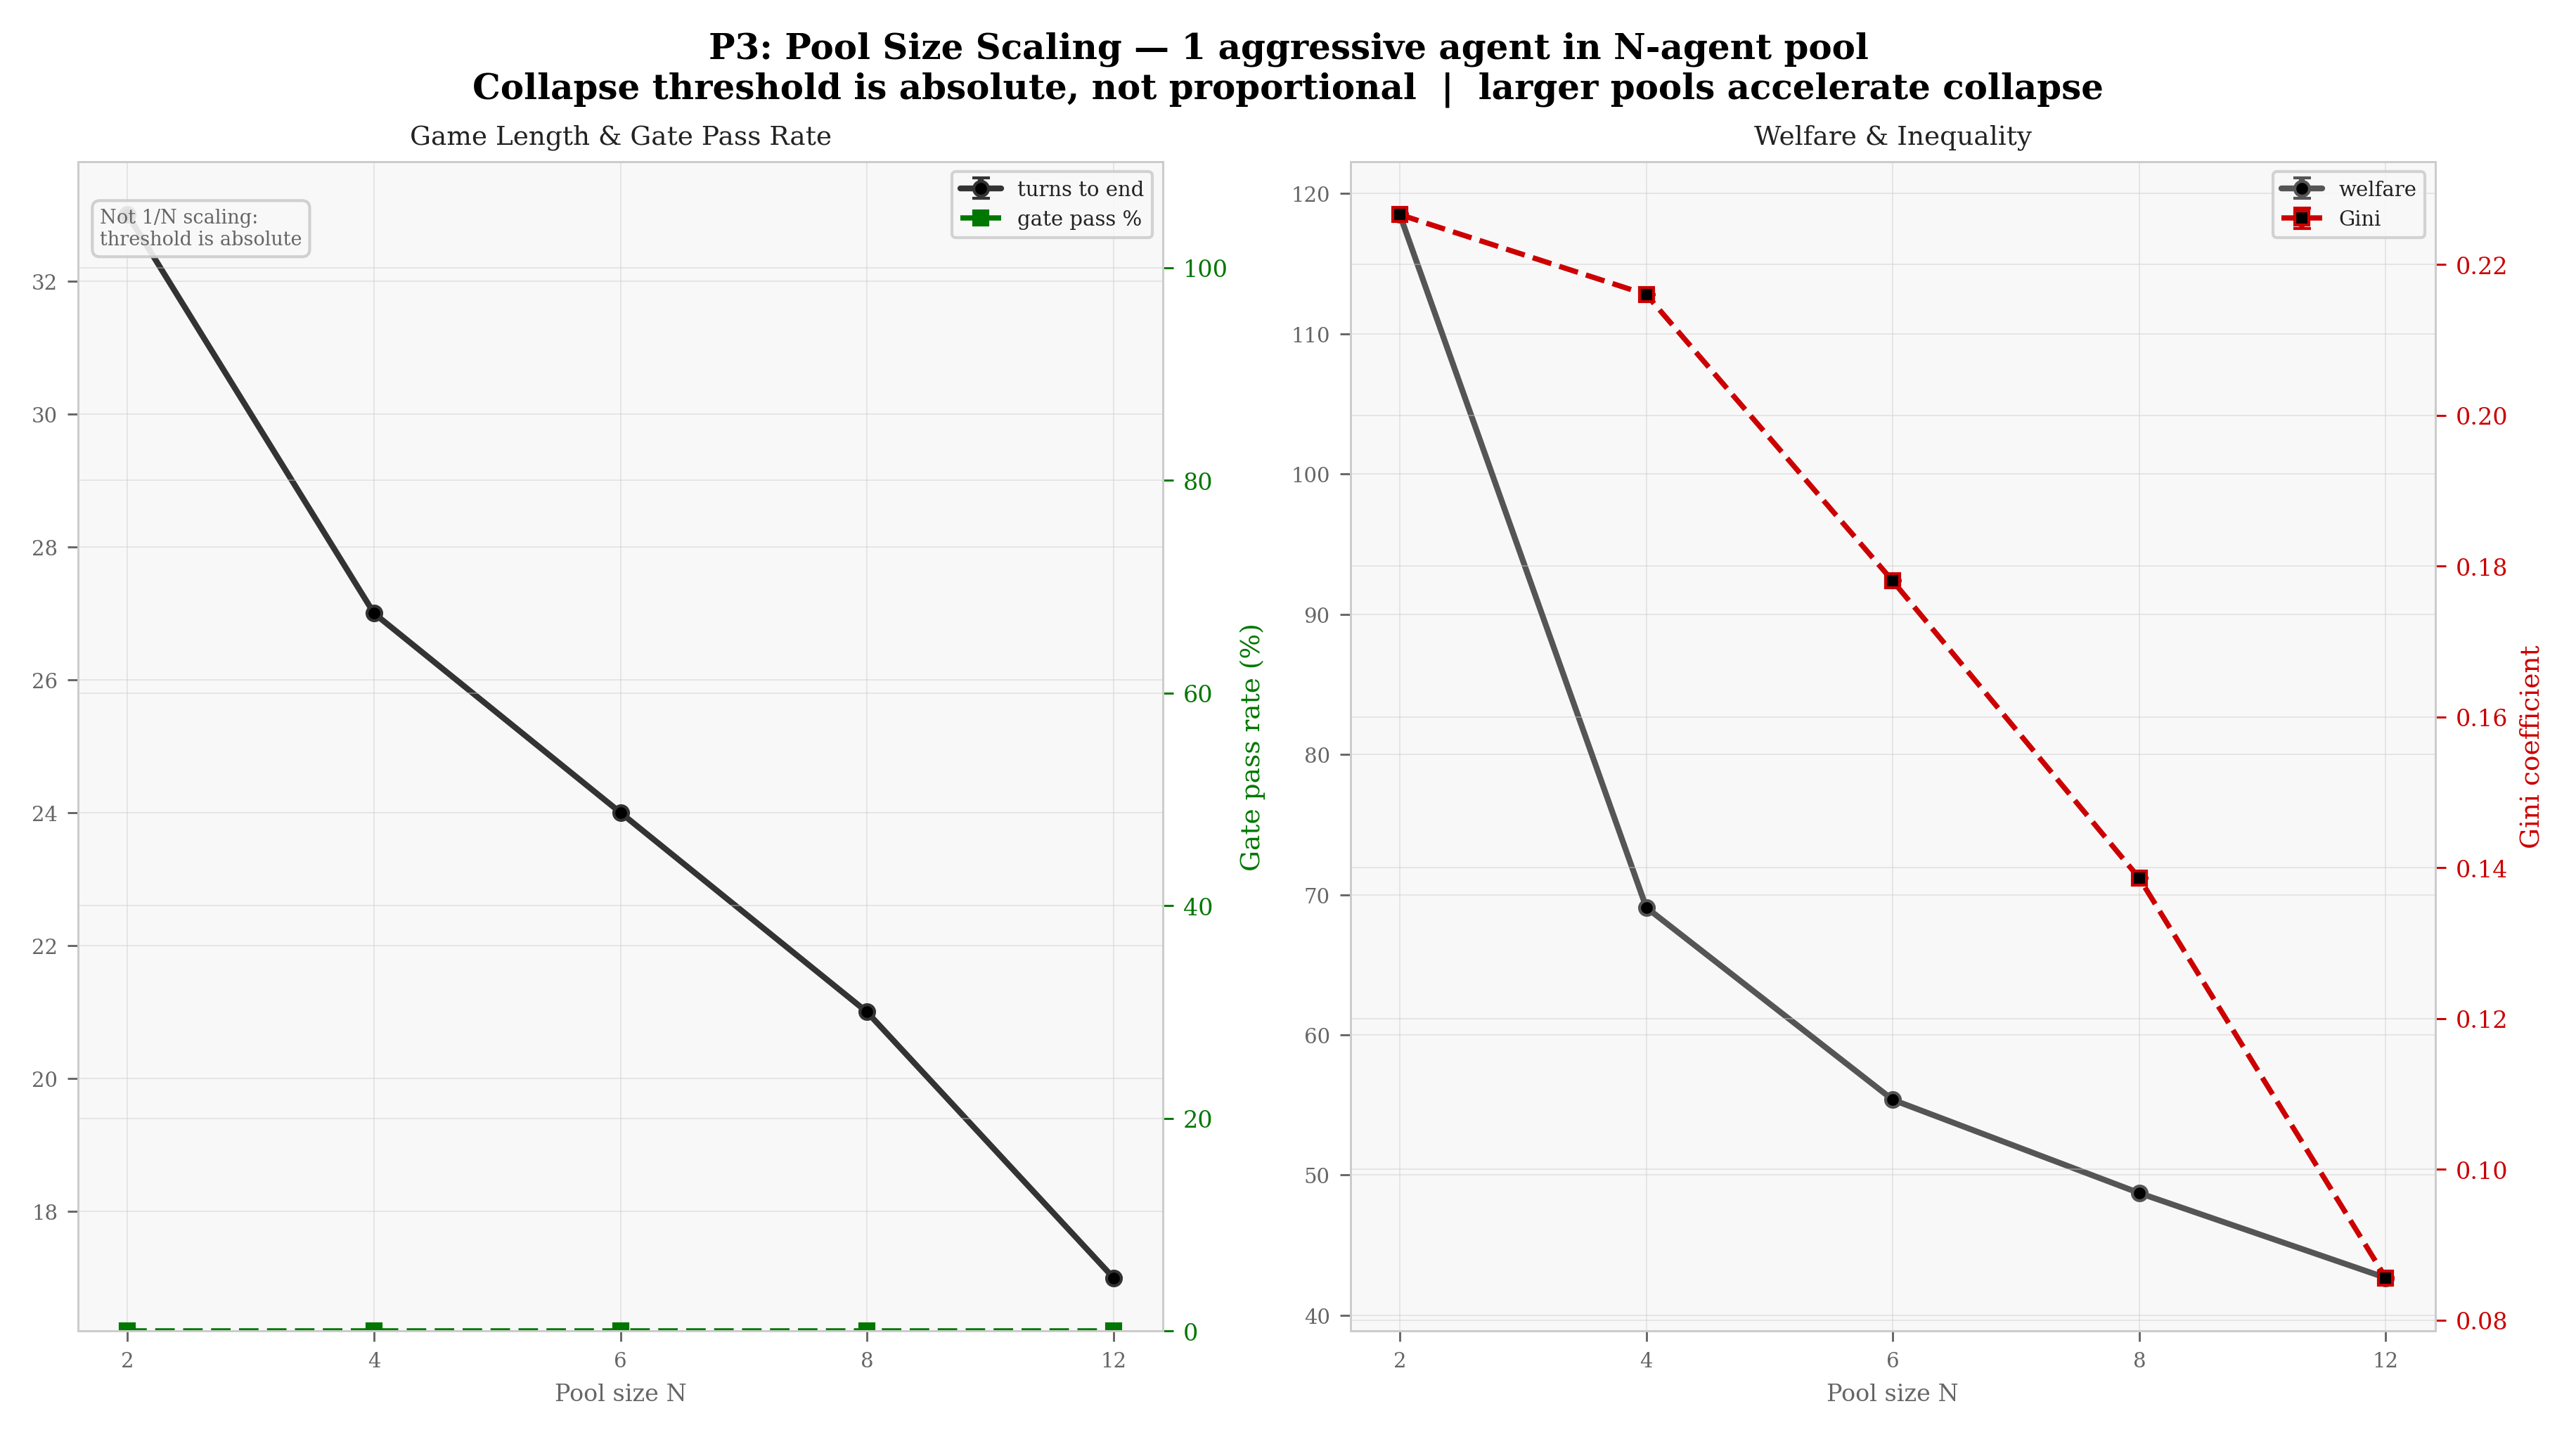
Adding conservative agents does not restore sustainability (Figure 3.5). The gate fails for all tested pool sizes: even the smallest possible pool (N = 2, one aggressive + one conservative) cannot sustain the commons against a single unconstrained aggressor. Counter-intuitively, game length decreases with N: larger pools mean more total harvest per turn, accelerating depletion. The Gini coefficient declines because the aggressive agent’s advantage is diluted across more players — but the gate still fails. This rules out the 1/N dilution hypothesis and confirms that the collapse threshold is a property of agent type composition, not a relative fraction.
P4 — Pool size fine sweep. A fine-grained continuation of P3: 1 aggressive agent in pools N = 8 to N = 20 (r = 0.12, all others conservative). The goal was to resolve whether any transition to gate passage existed in the N = 8–20 range, and to characterise the relationship between pool size, game length, and inequality in the collapse-certain regime.
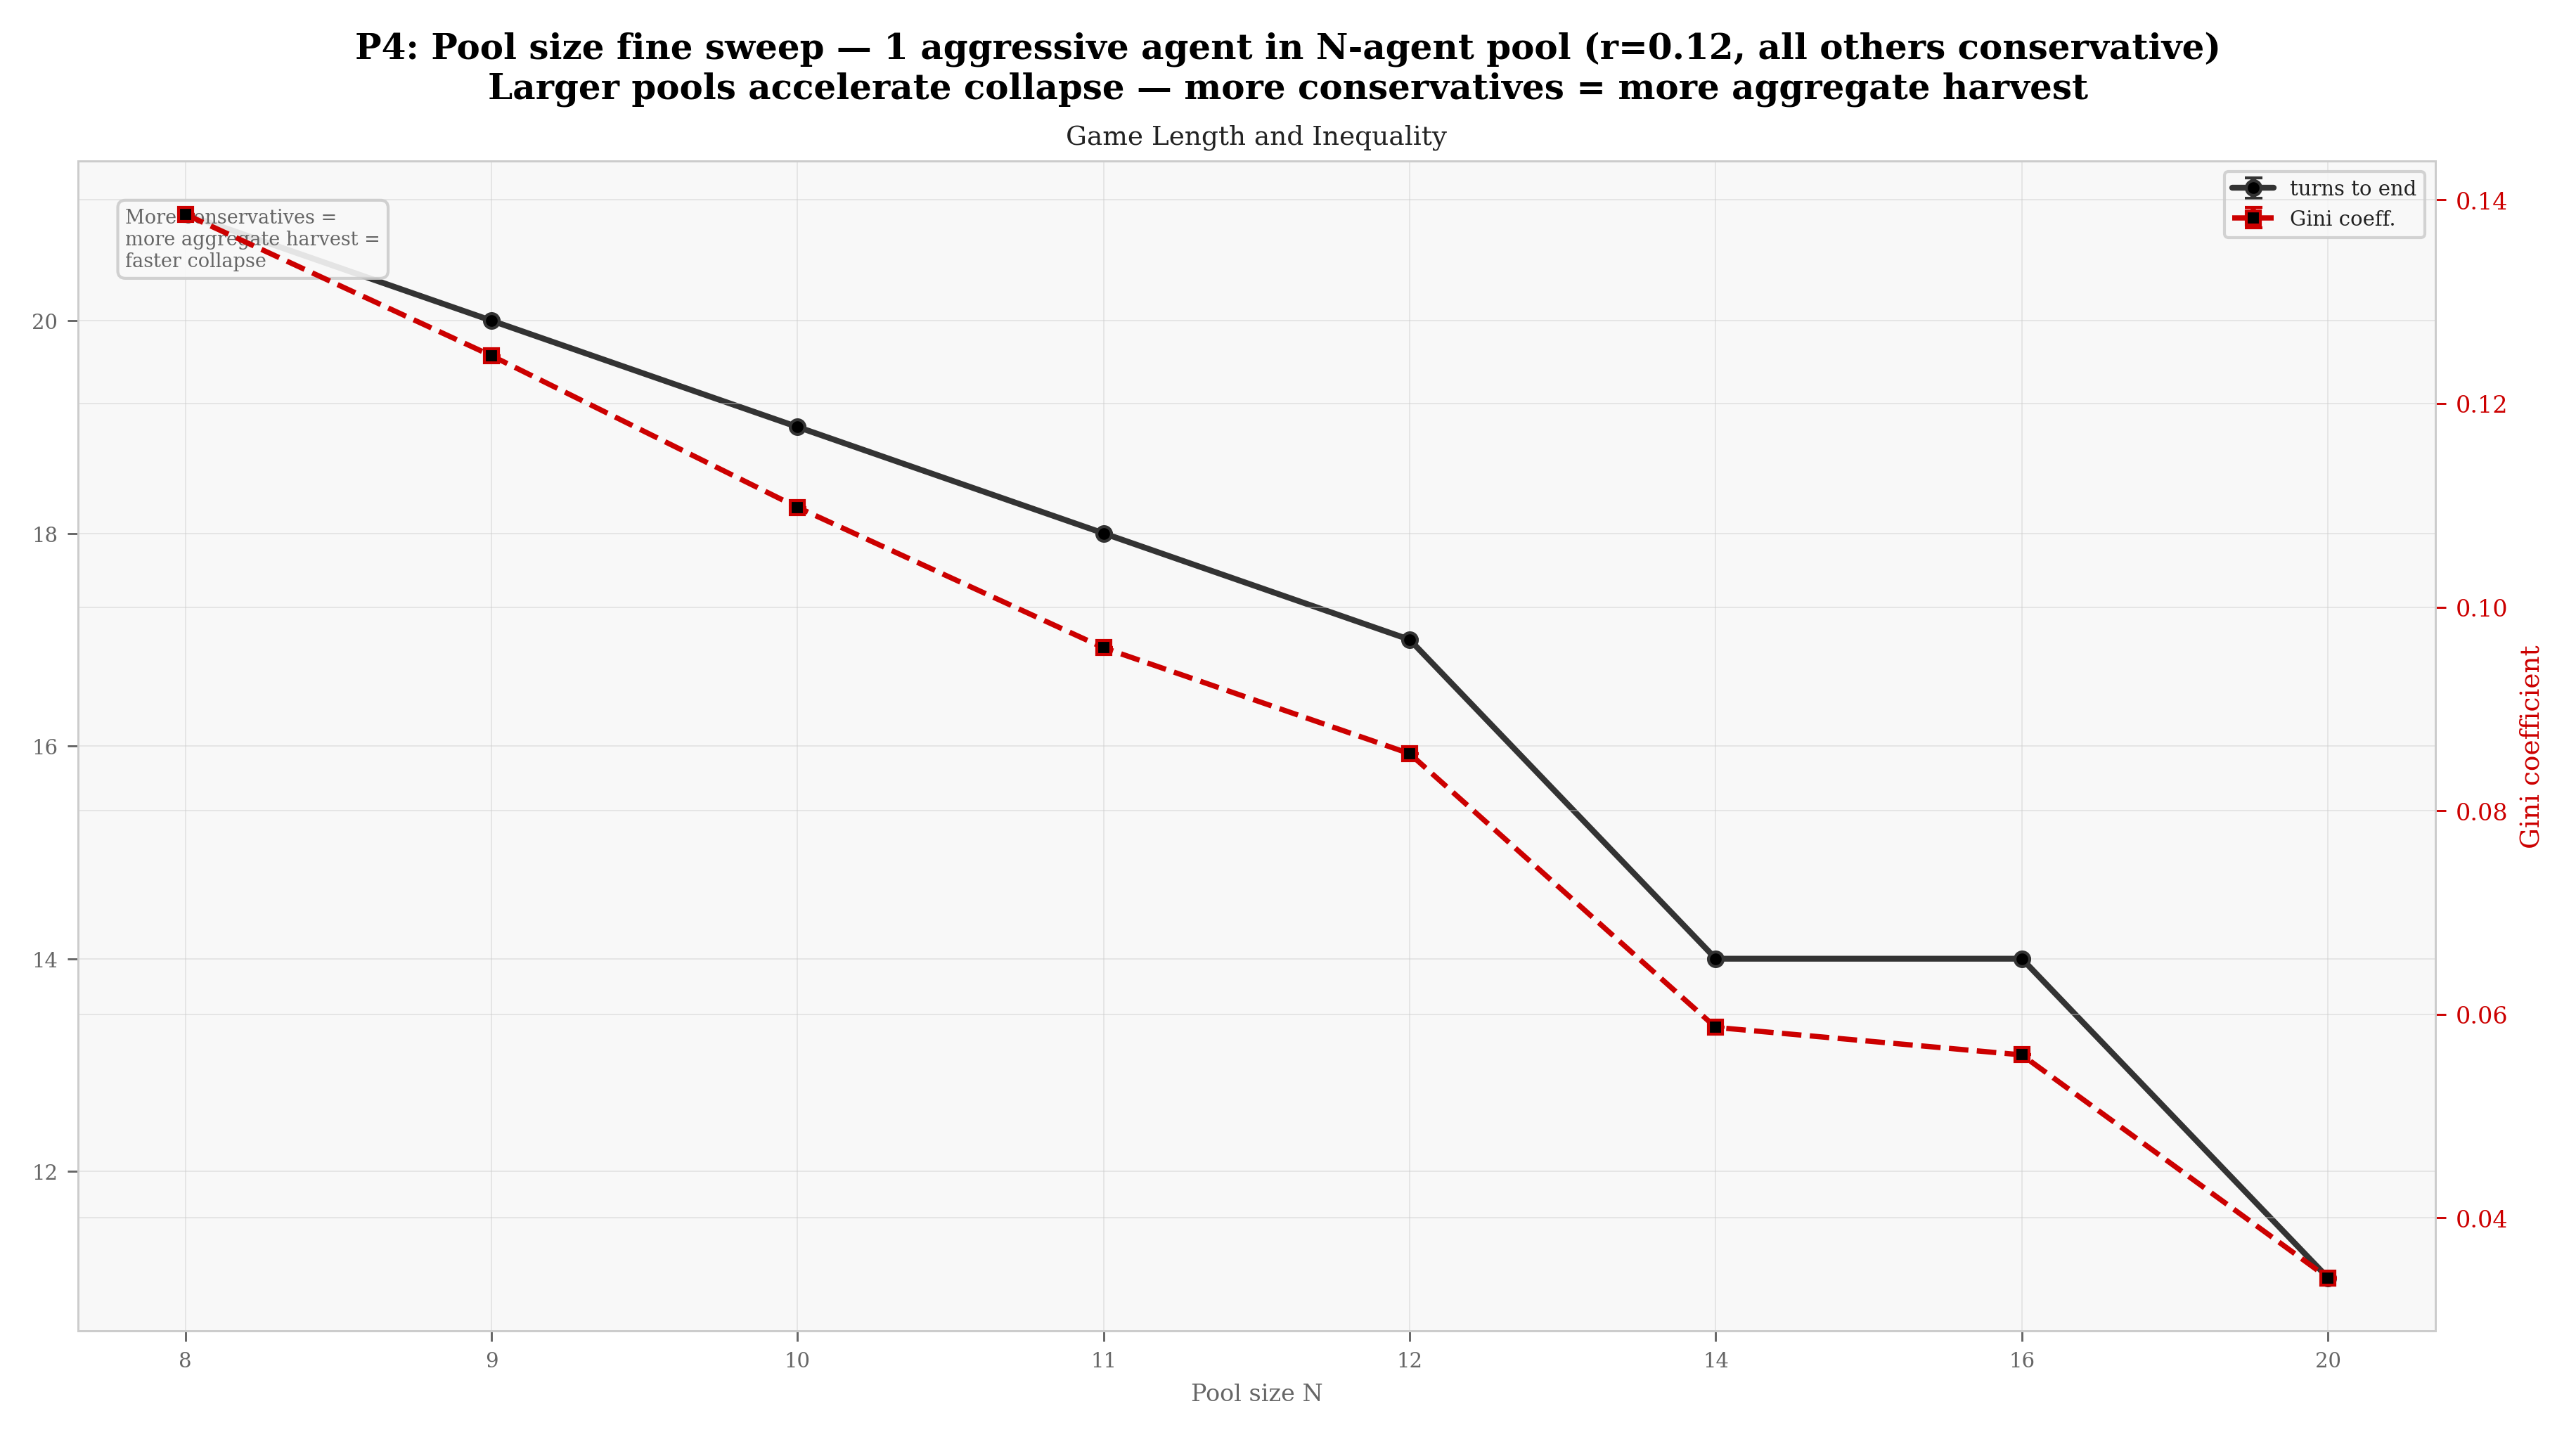
Game length declines monotonically from 21 turns (N = 8) to 11 turns (N = 20): each additional conservative agent adds to aggregate harvest, depleting the commons faster despite individually moderate extraction (Figure 3.6). Scaling the pool cannot rescue the gate; in large pools, the mechanism of collapse is aggregate extraction, not individual aggression.
P5 — 2D parametric map: regen rate \(\times\) aggressive fraction. A full 2D parametric sweep: regen rate \(r \in \{0.06, 0.10, 0.14, 0.18, 0.24, 0.32\}\) \(\times\) aggressive agents \(\in \{0, 1, 2, 4, 6\}\) in a 6-agent pool (20 runs per point). This maps the gate pass rate and welfare score across the joint parameter space, identifying the collapse frontier — the boundary separating parameter regions where cooperative outcomes are achievable from those where collapse is inevitable.
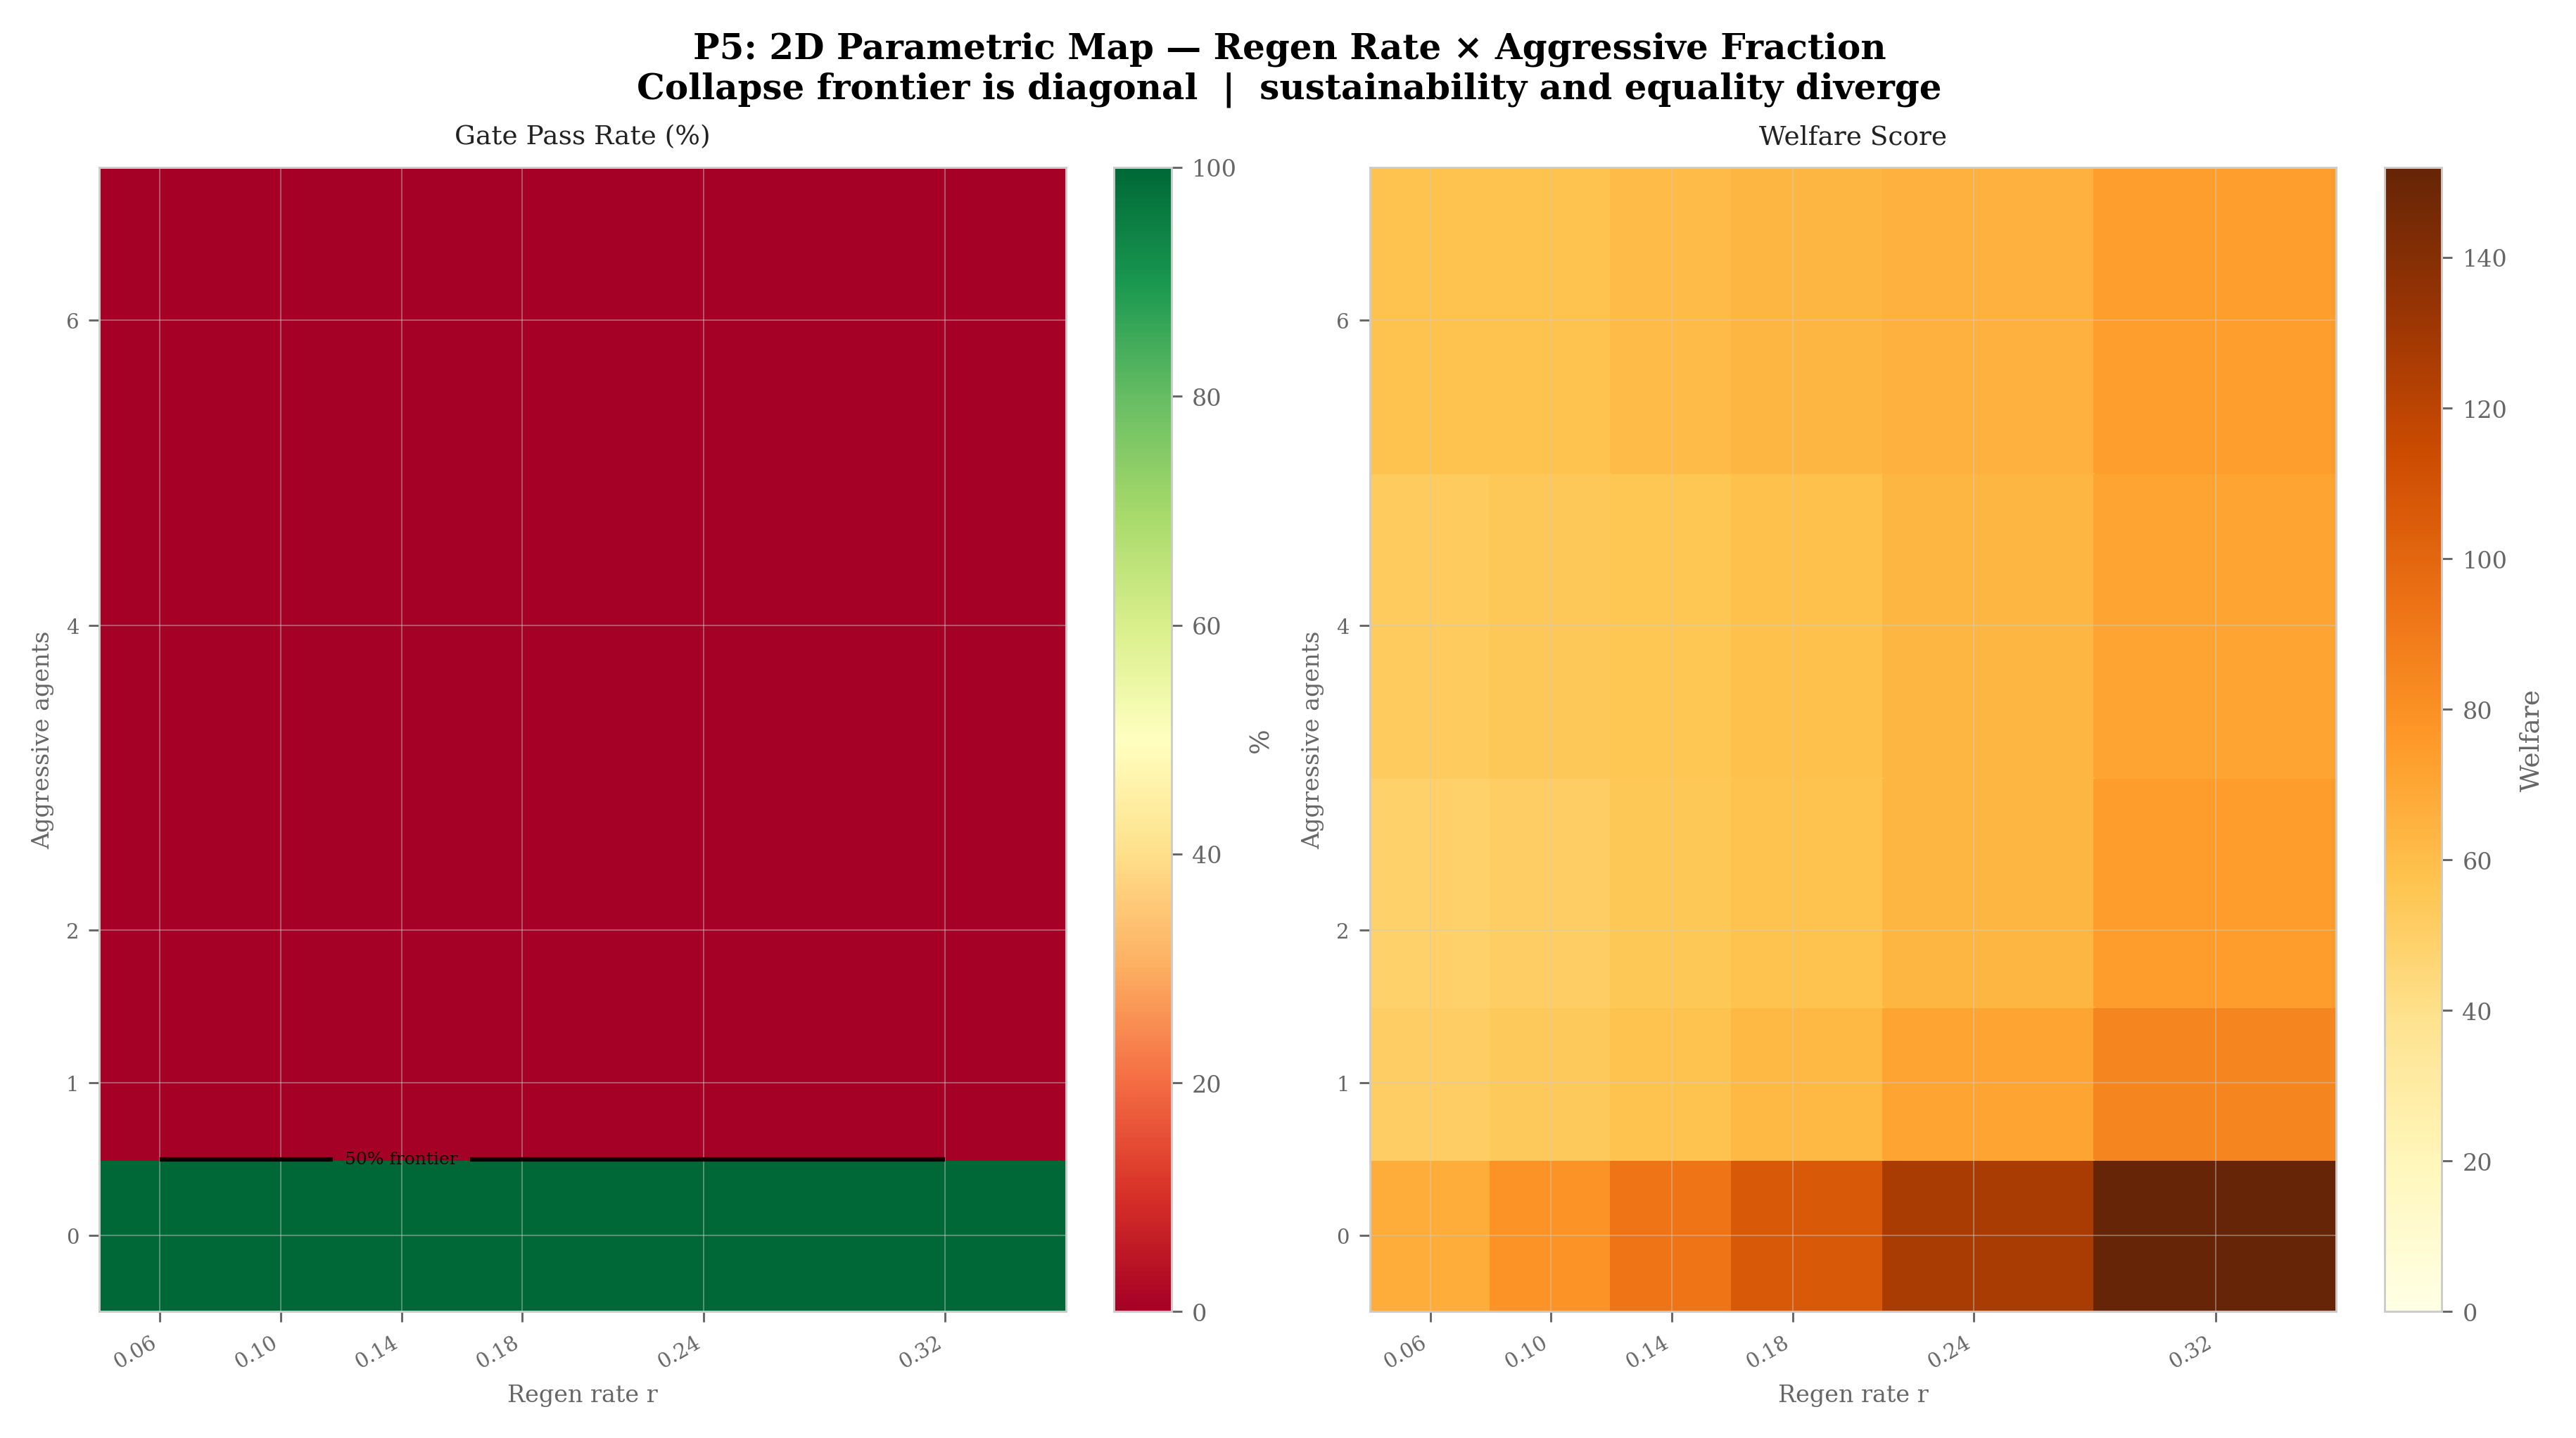
The 2D sweep (Figure 3.7) confirms the step-collapse threshold identified in P1–P3: a single aggressive agent reduces gate passage to 0% across the tested regen rates (\(r \in [0.06, 0.32]\); see B3, Appendix B, for the high-r boundary at \(r \approx 0.95\)). Welfare, however, rises with regen rate even in collapsing configurations — higher \(r\) extends game length and allows more extraction before collapse. This divergence between gate pass rate and welfare illustrates a fundamental tension: the conditions that maximise individual welfare are not the conditions that preserve the commons.
The same threshold question can now be posed on the stochastic substrate. The next two card-tournament sweeps re-examine RQ1 under the Forest Die, where the Arena’s binary cliff becomes a probabilistic frontier.
3.2.1 CT1 — Collapse-Rate Matrix: Archetype vs. Archetype
The most direct card-game analogue of the aggressive-fraction sweep (P1) is a round-robin of all ordered archetype pairs. We ran every combination of the four decks against each other in a two-player format (9 rounds, 200 games per matchup), recording collapse rate and Seneca Clip trigger rate (Figure 3.8).

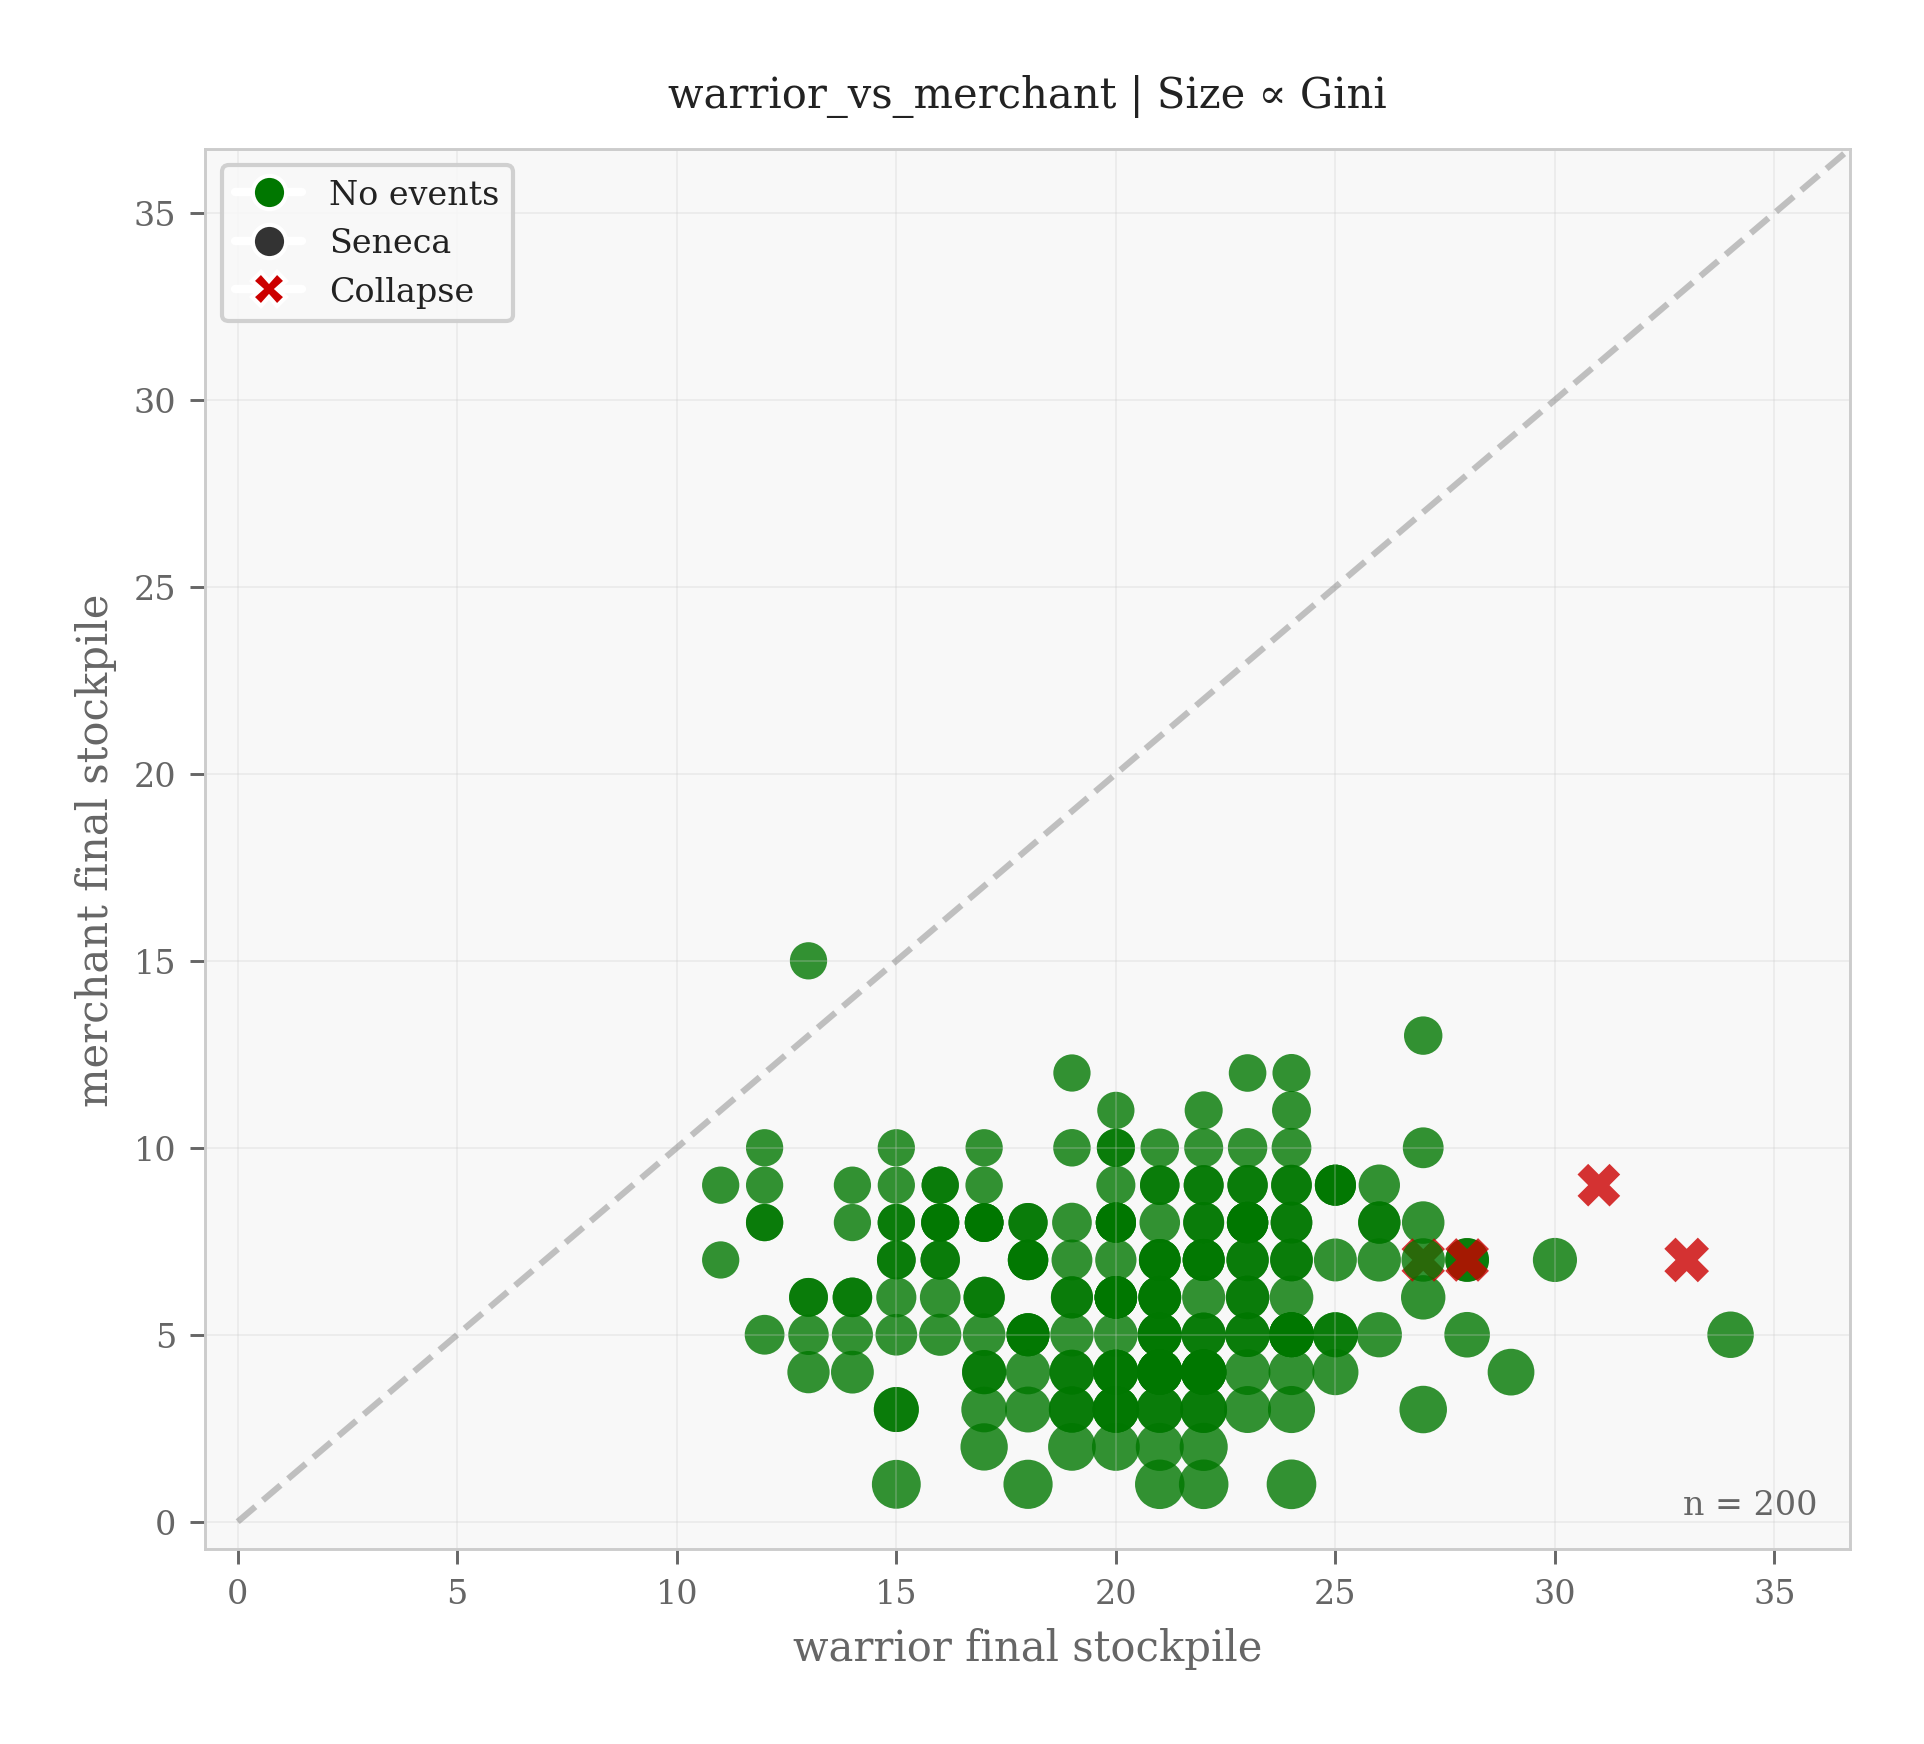
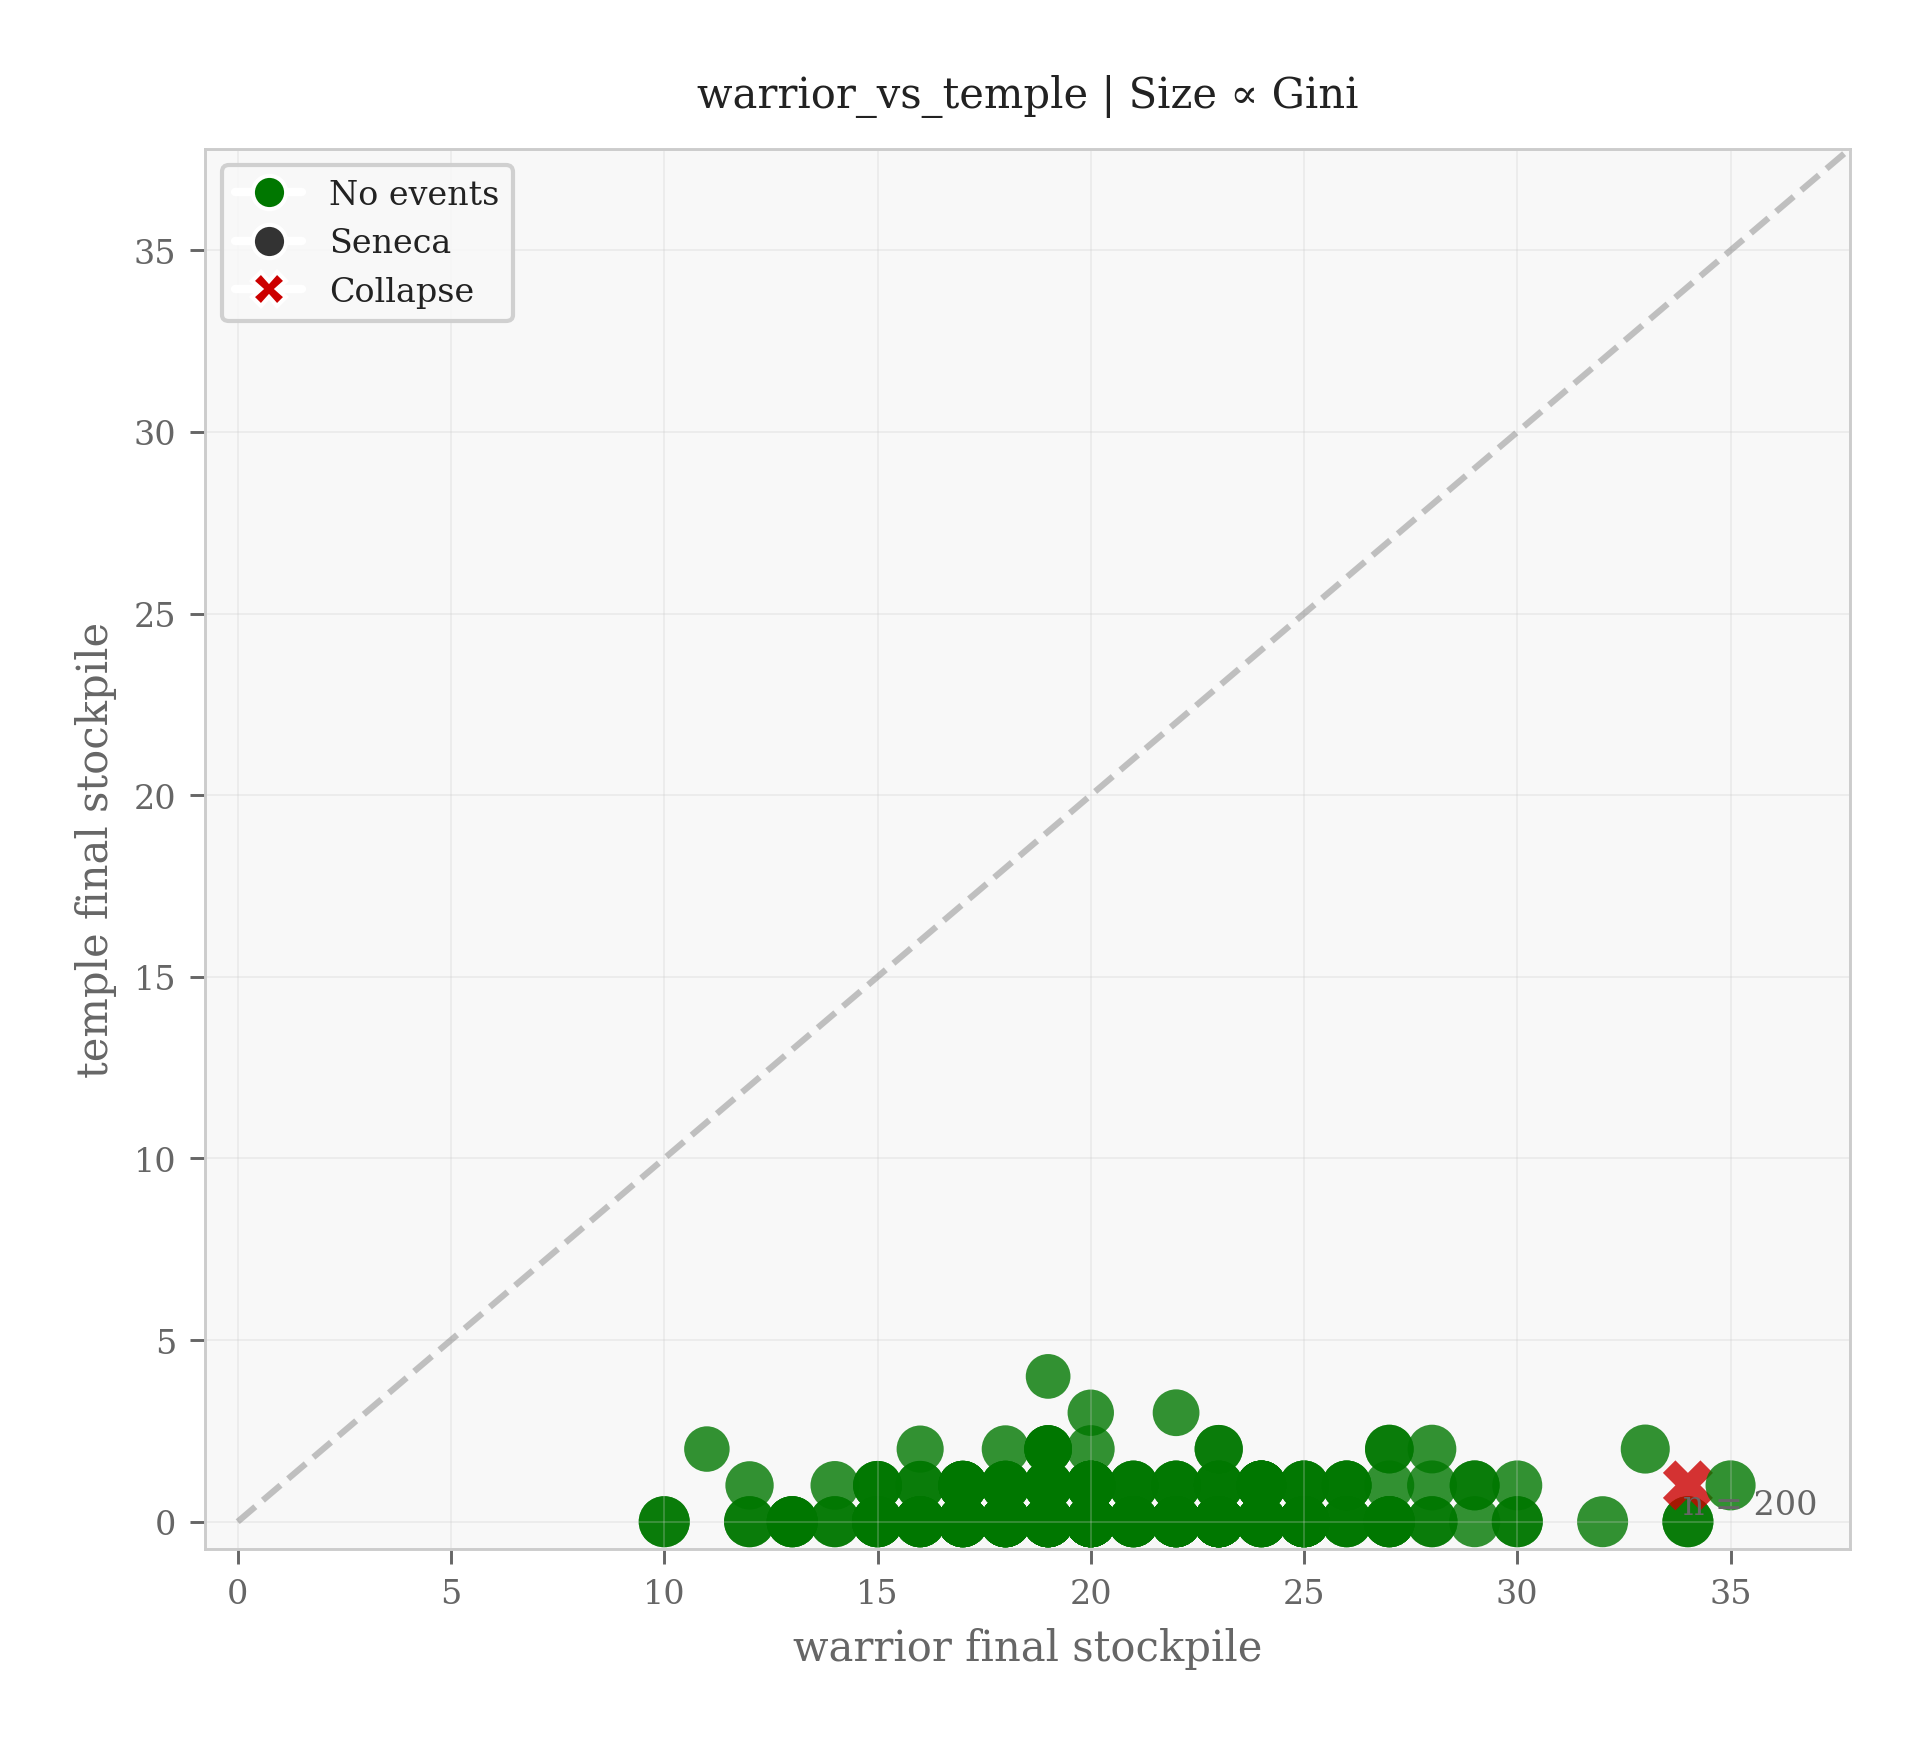
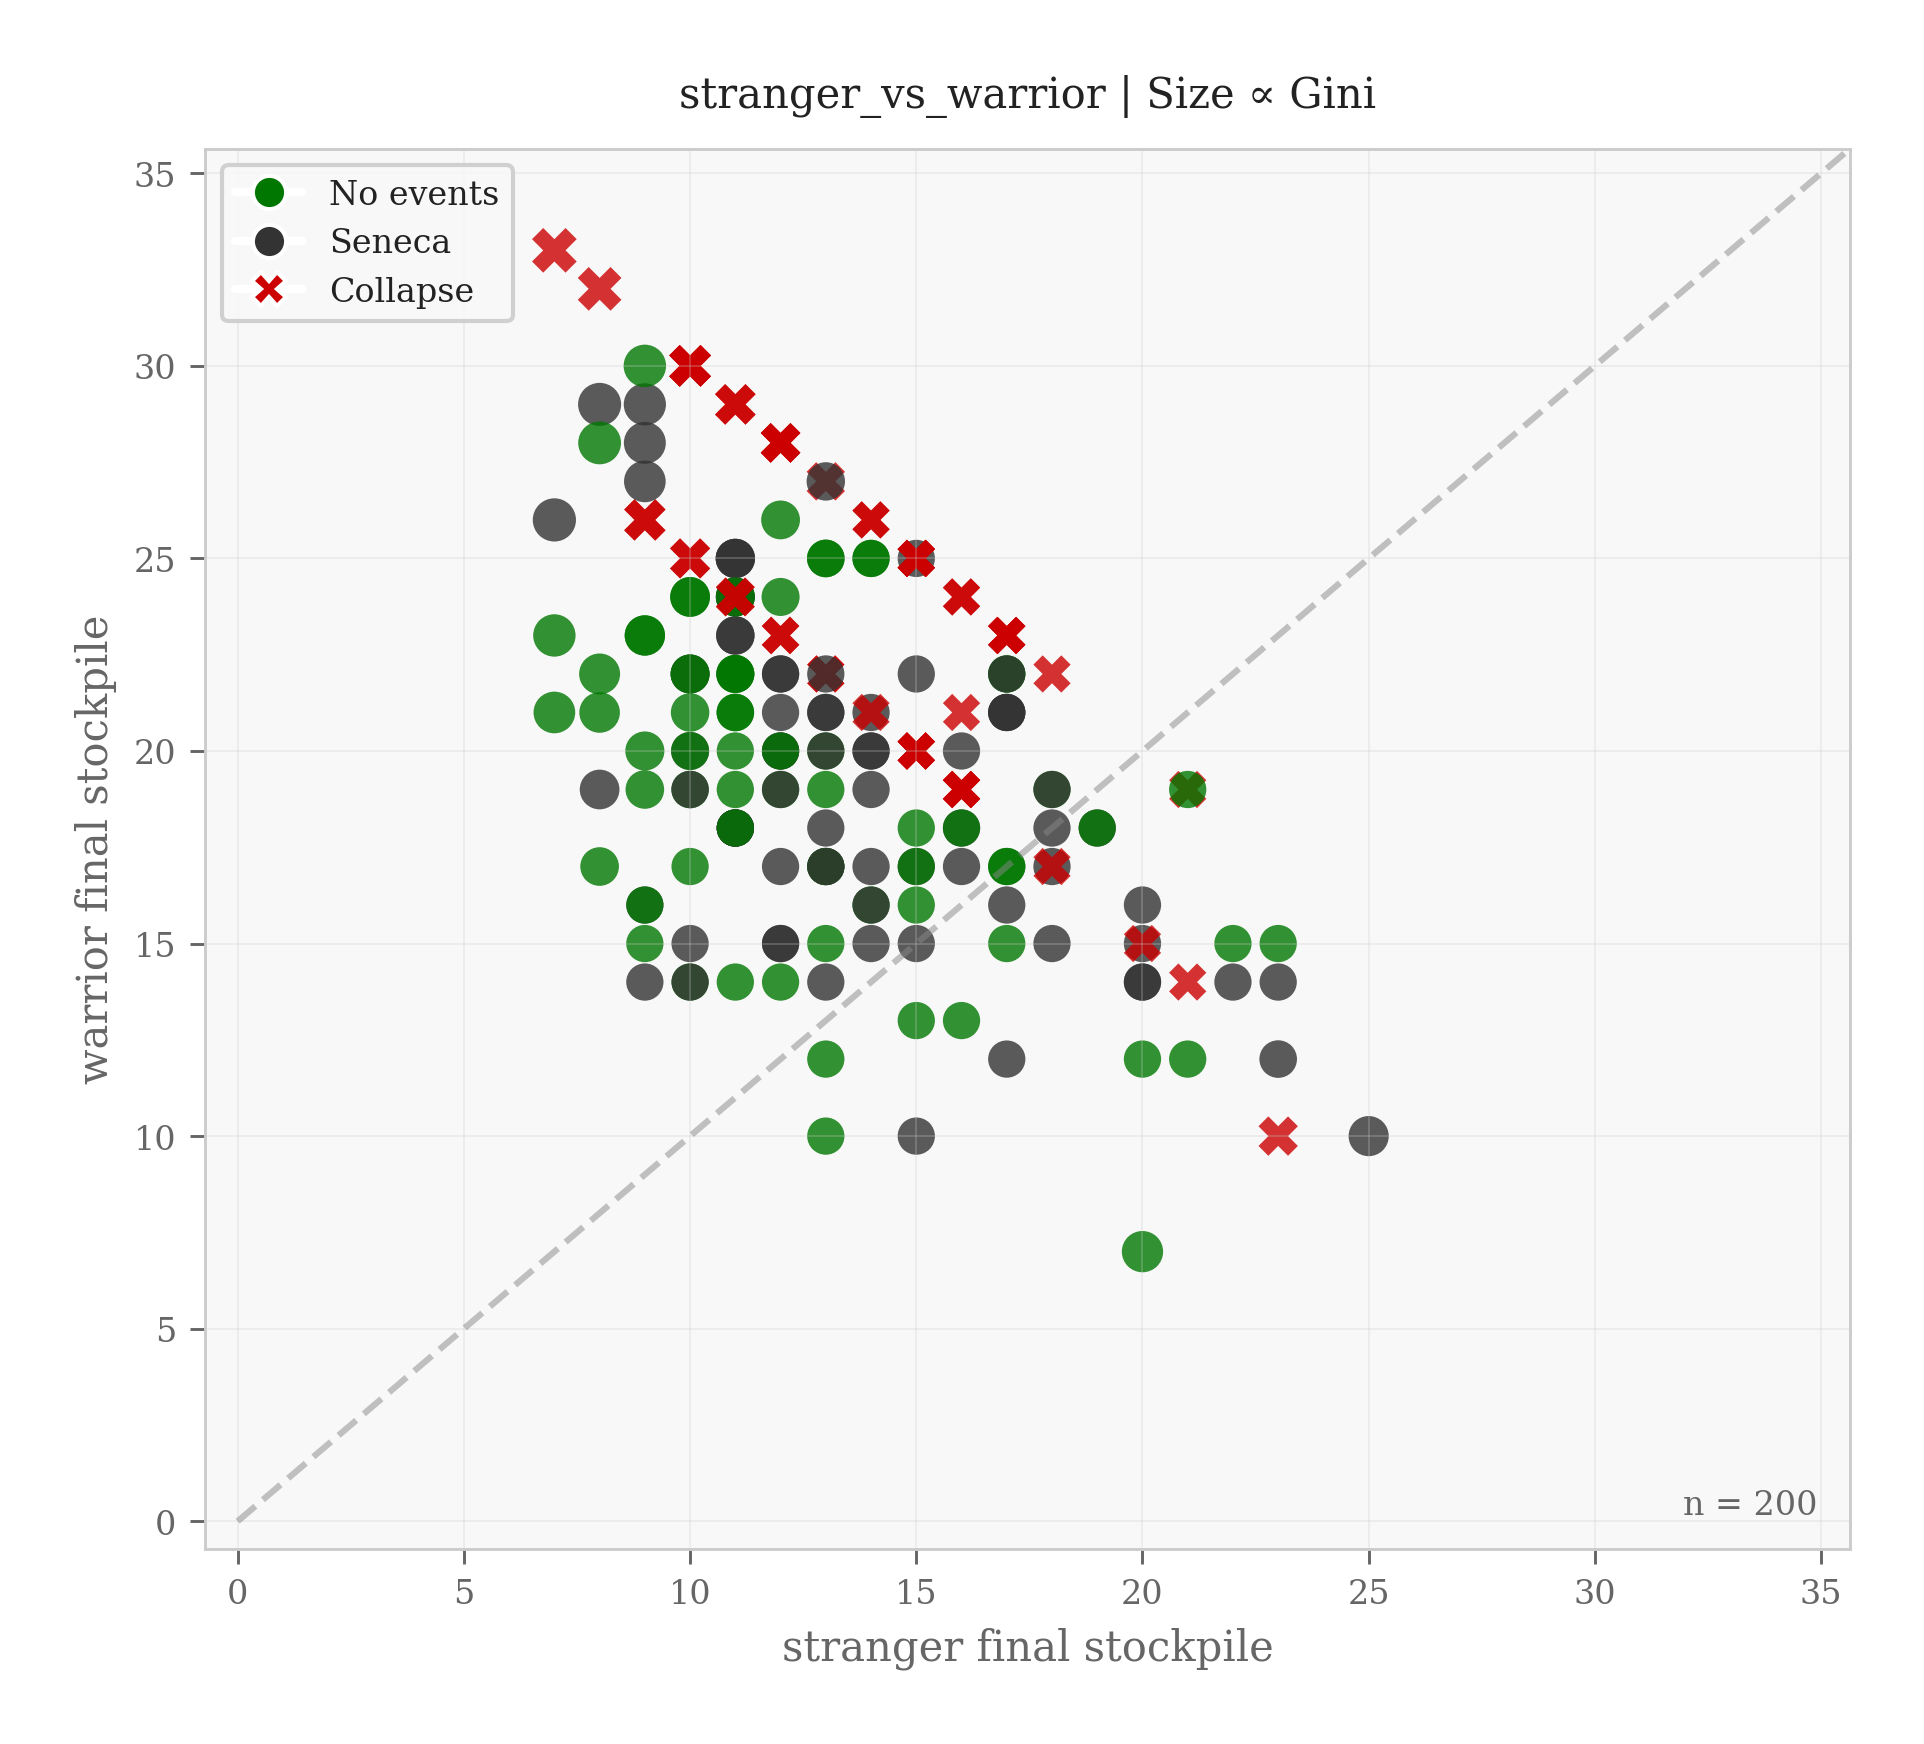
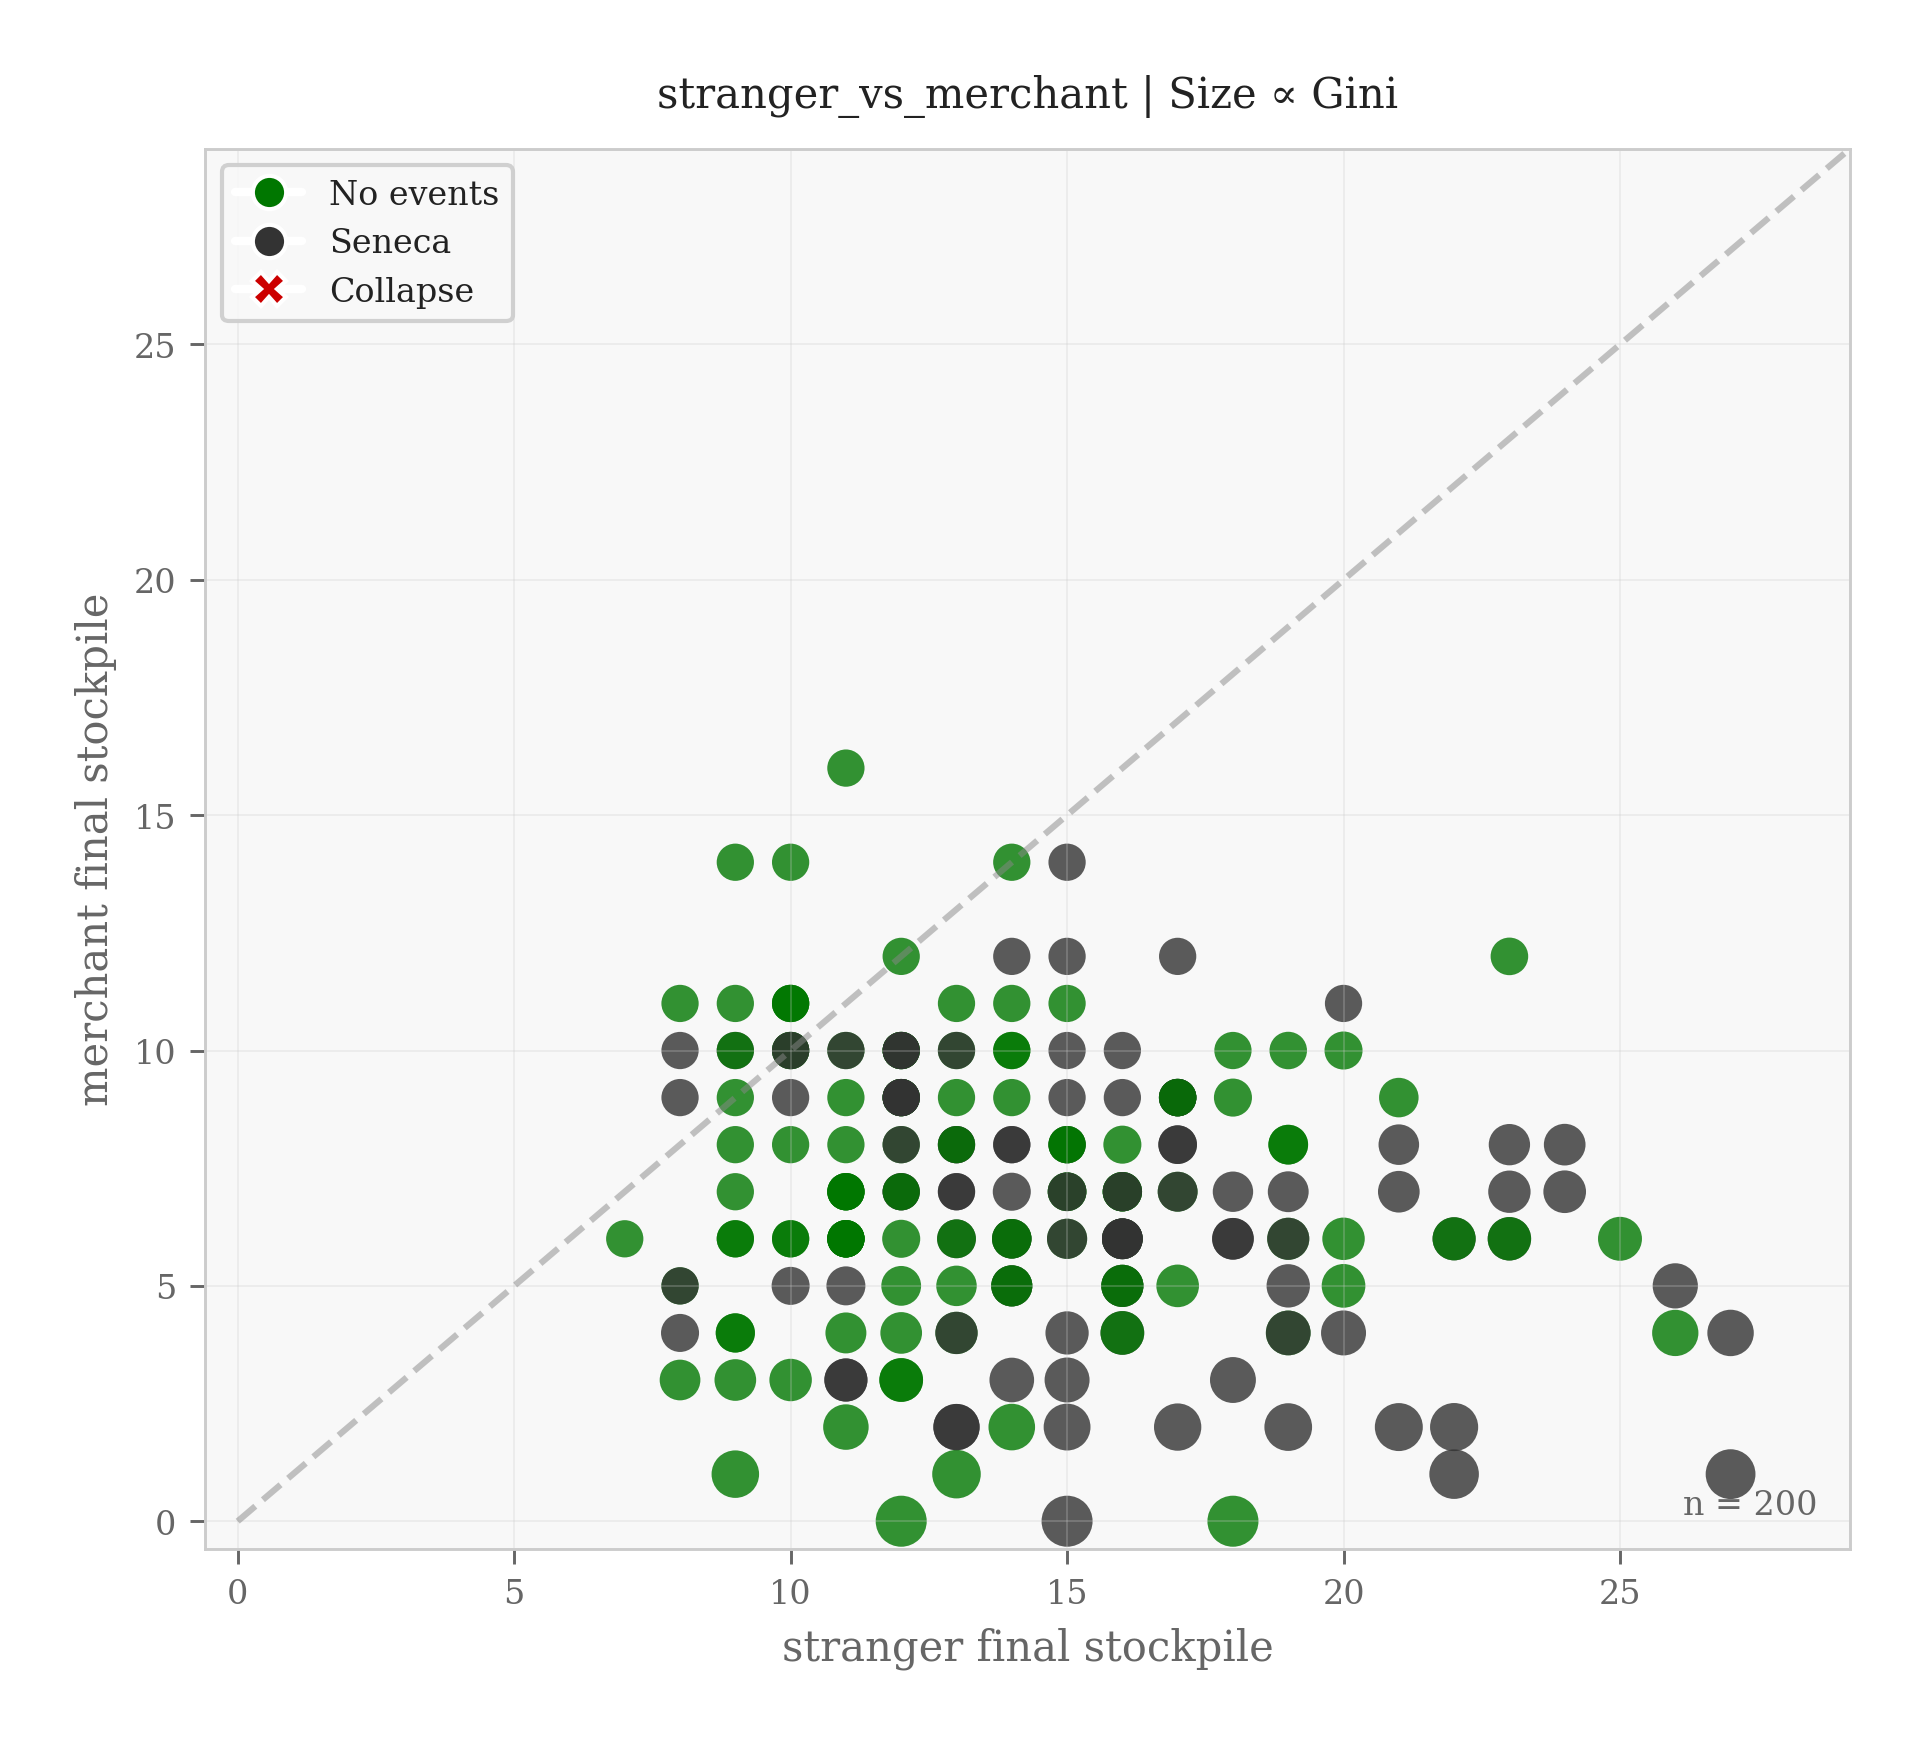
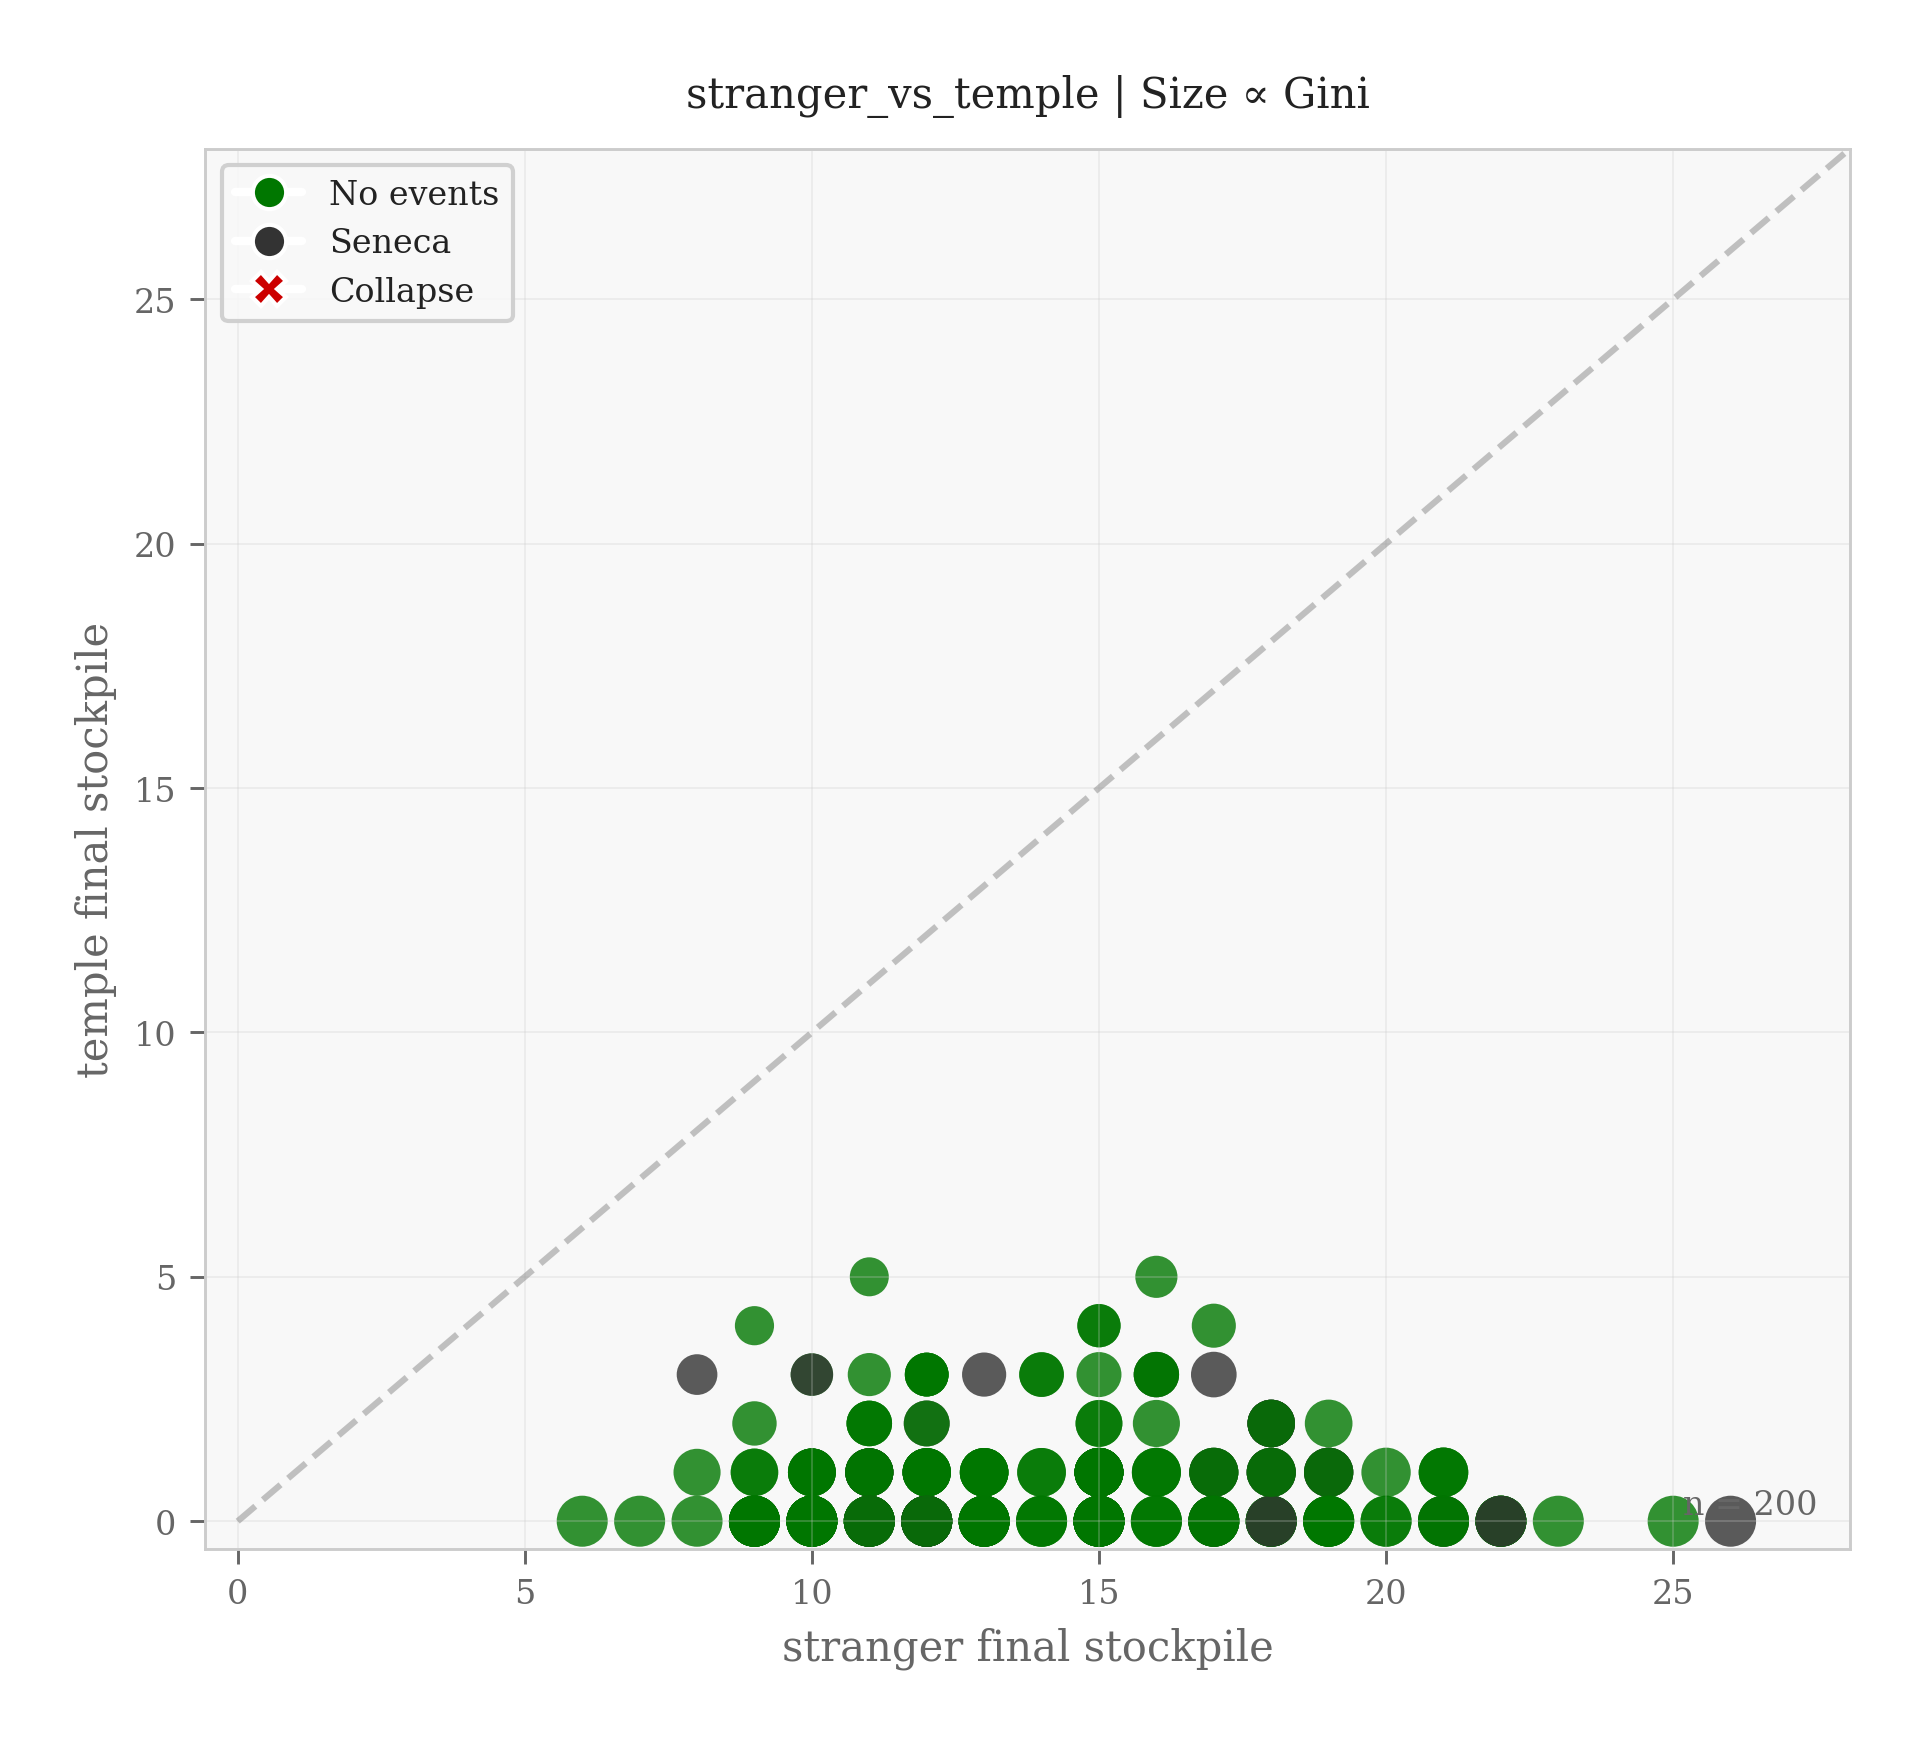
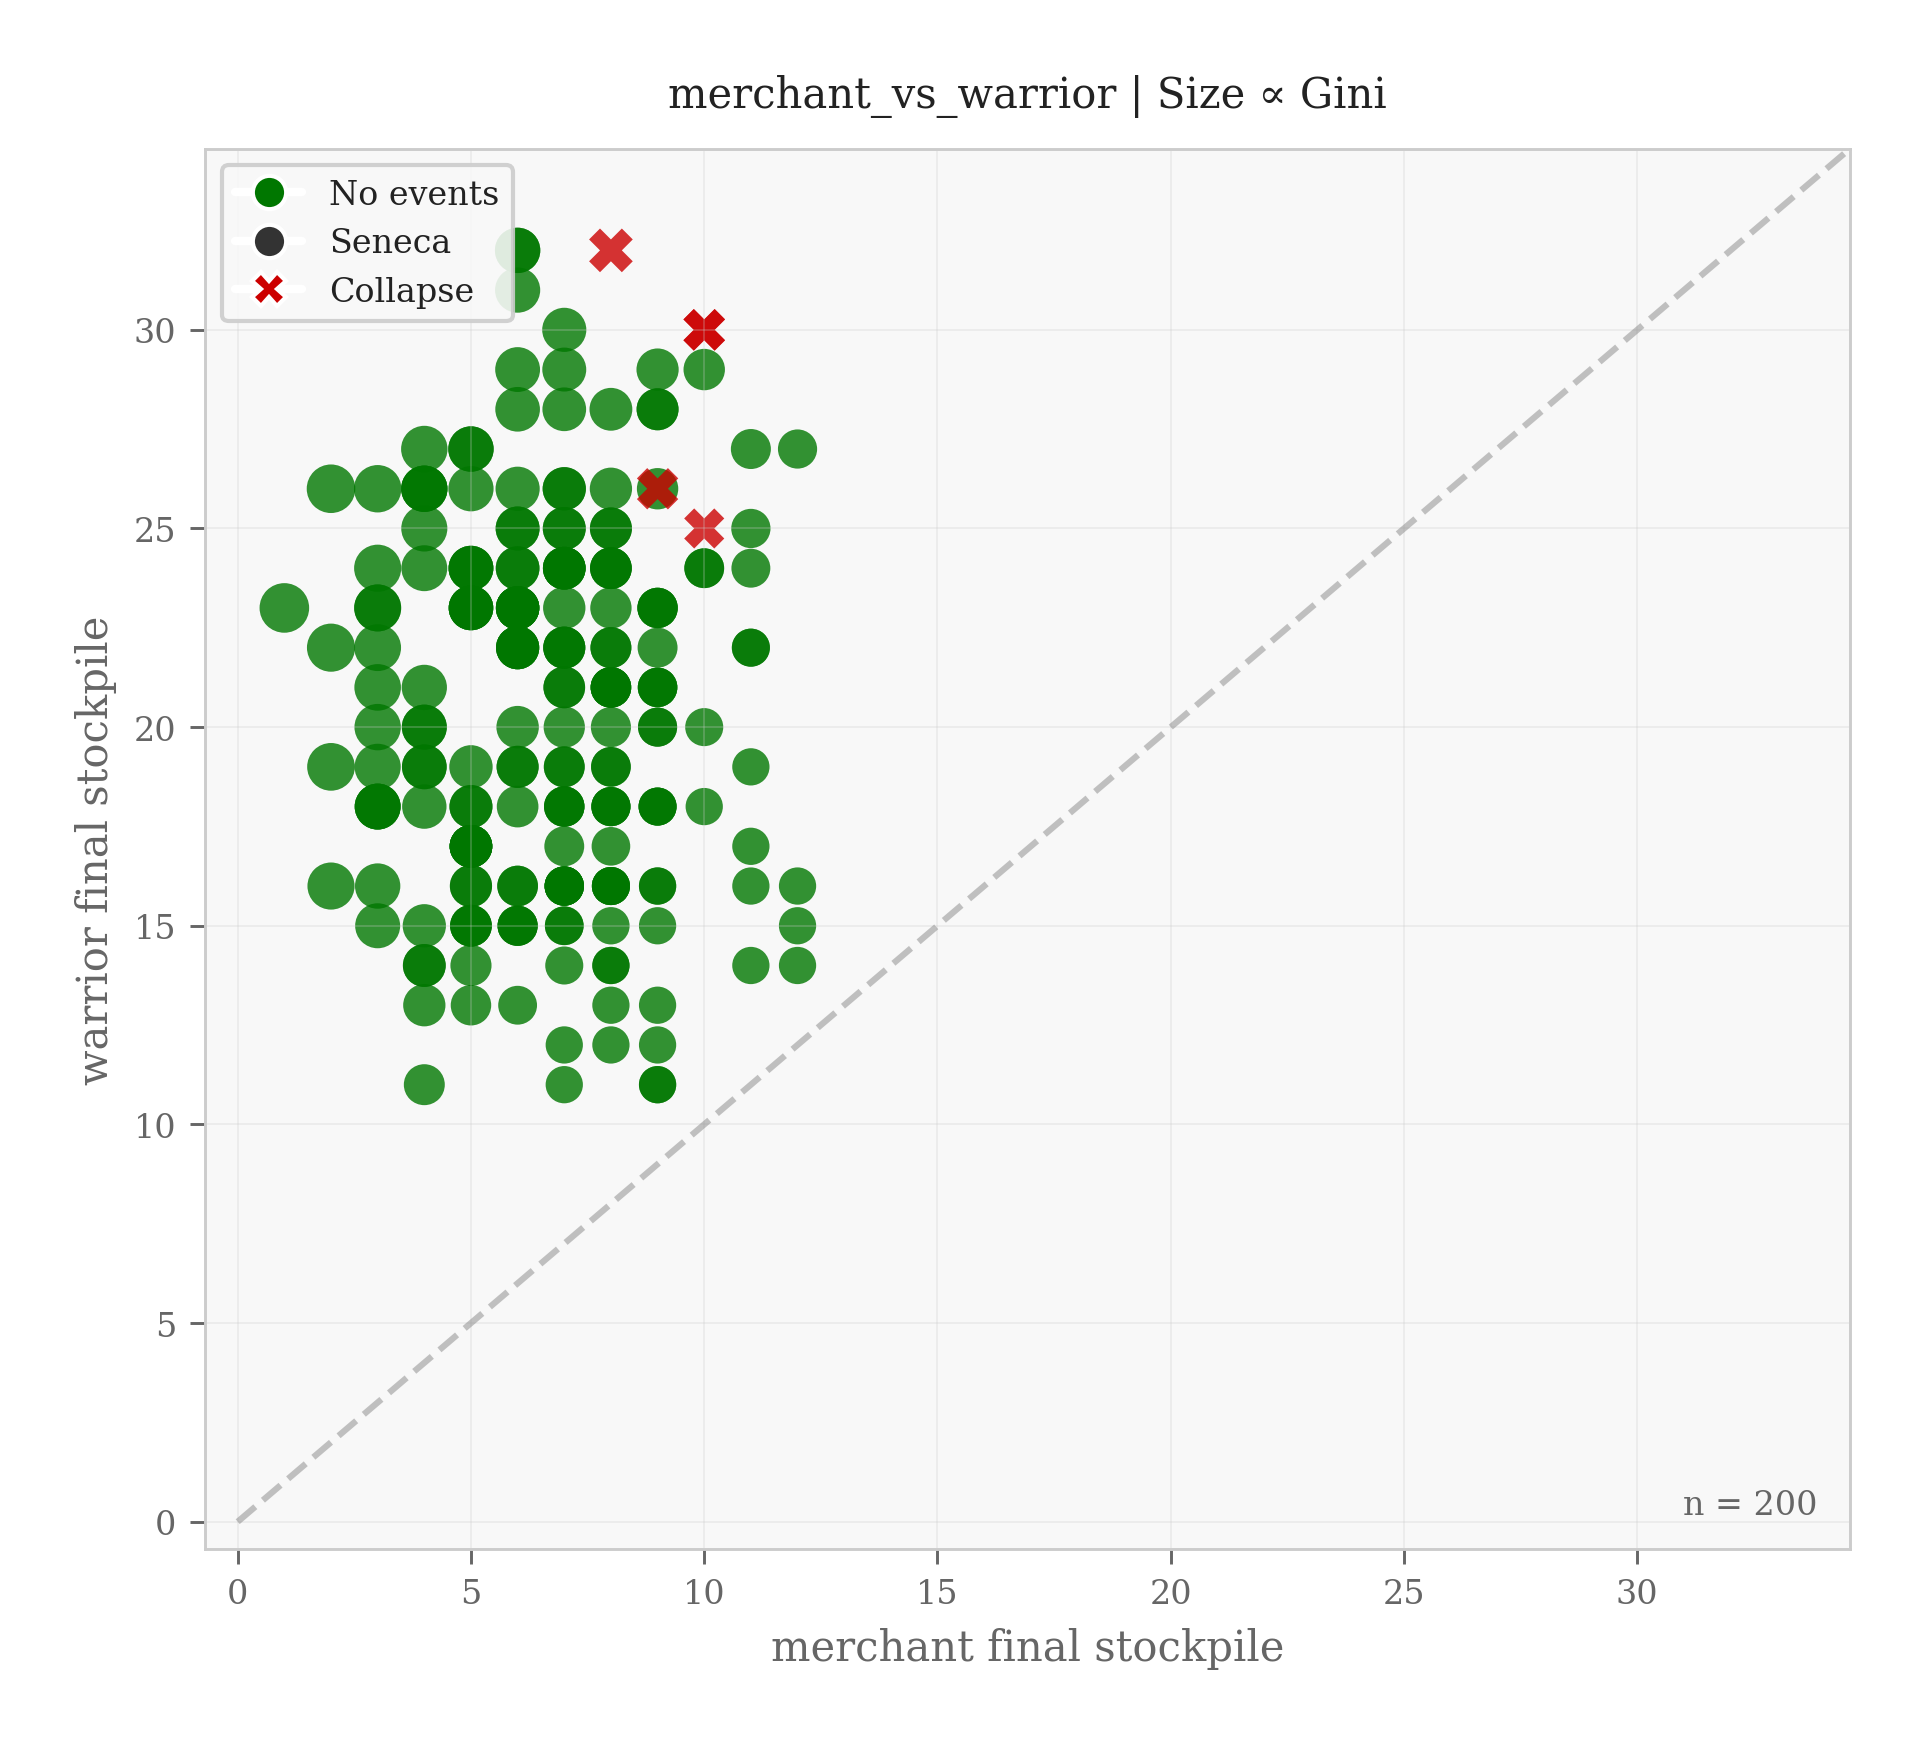
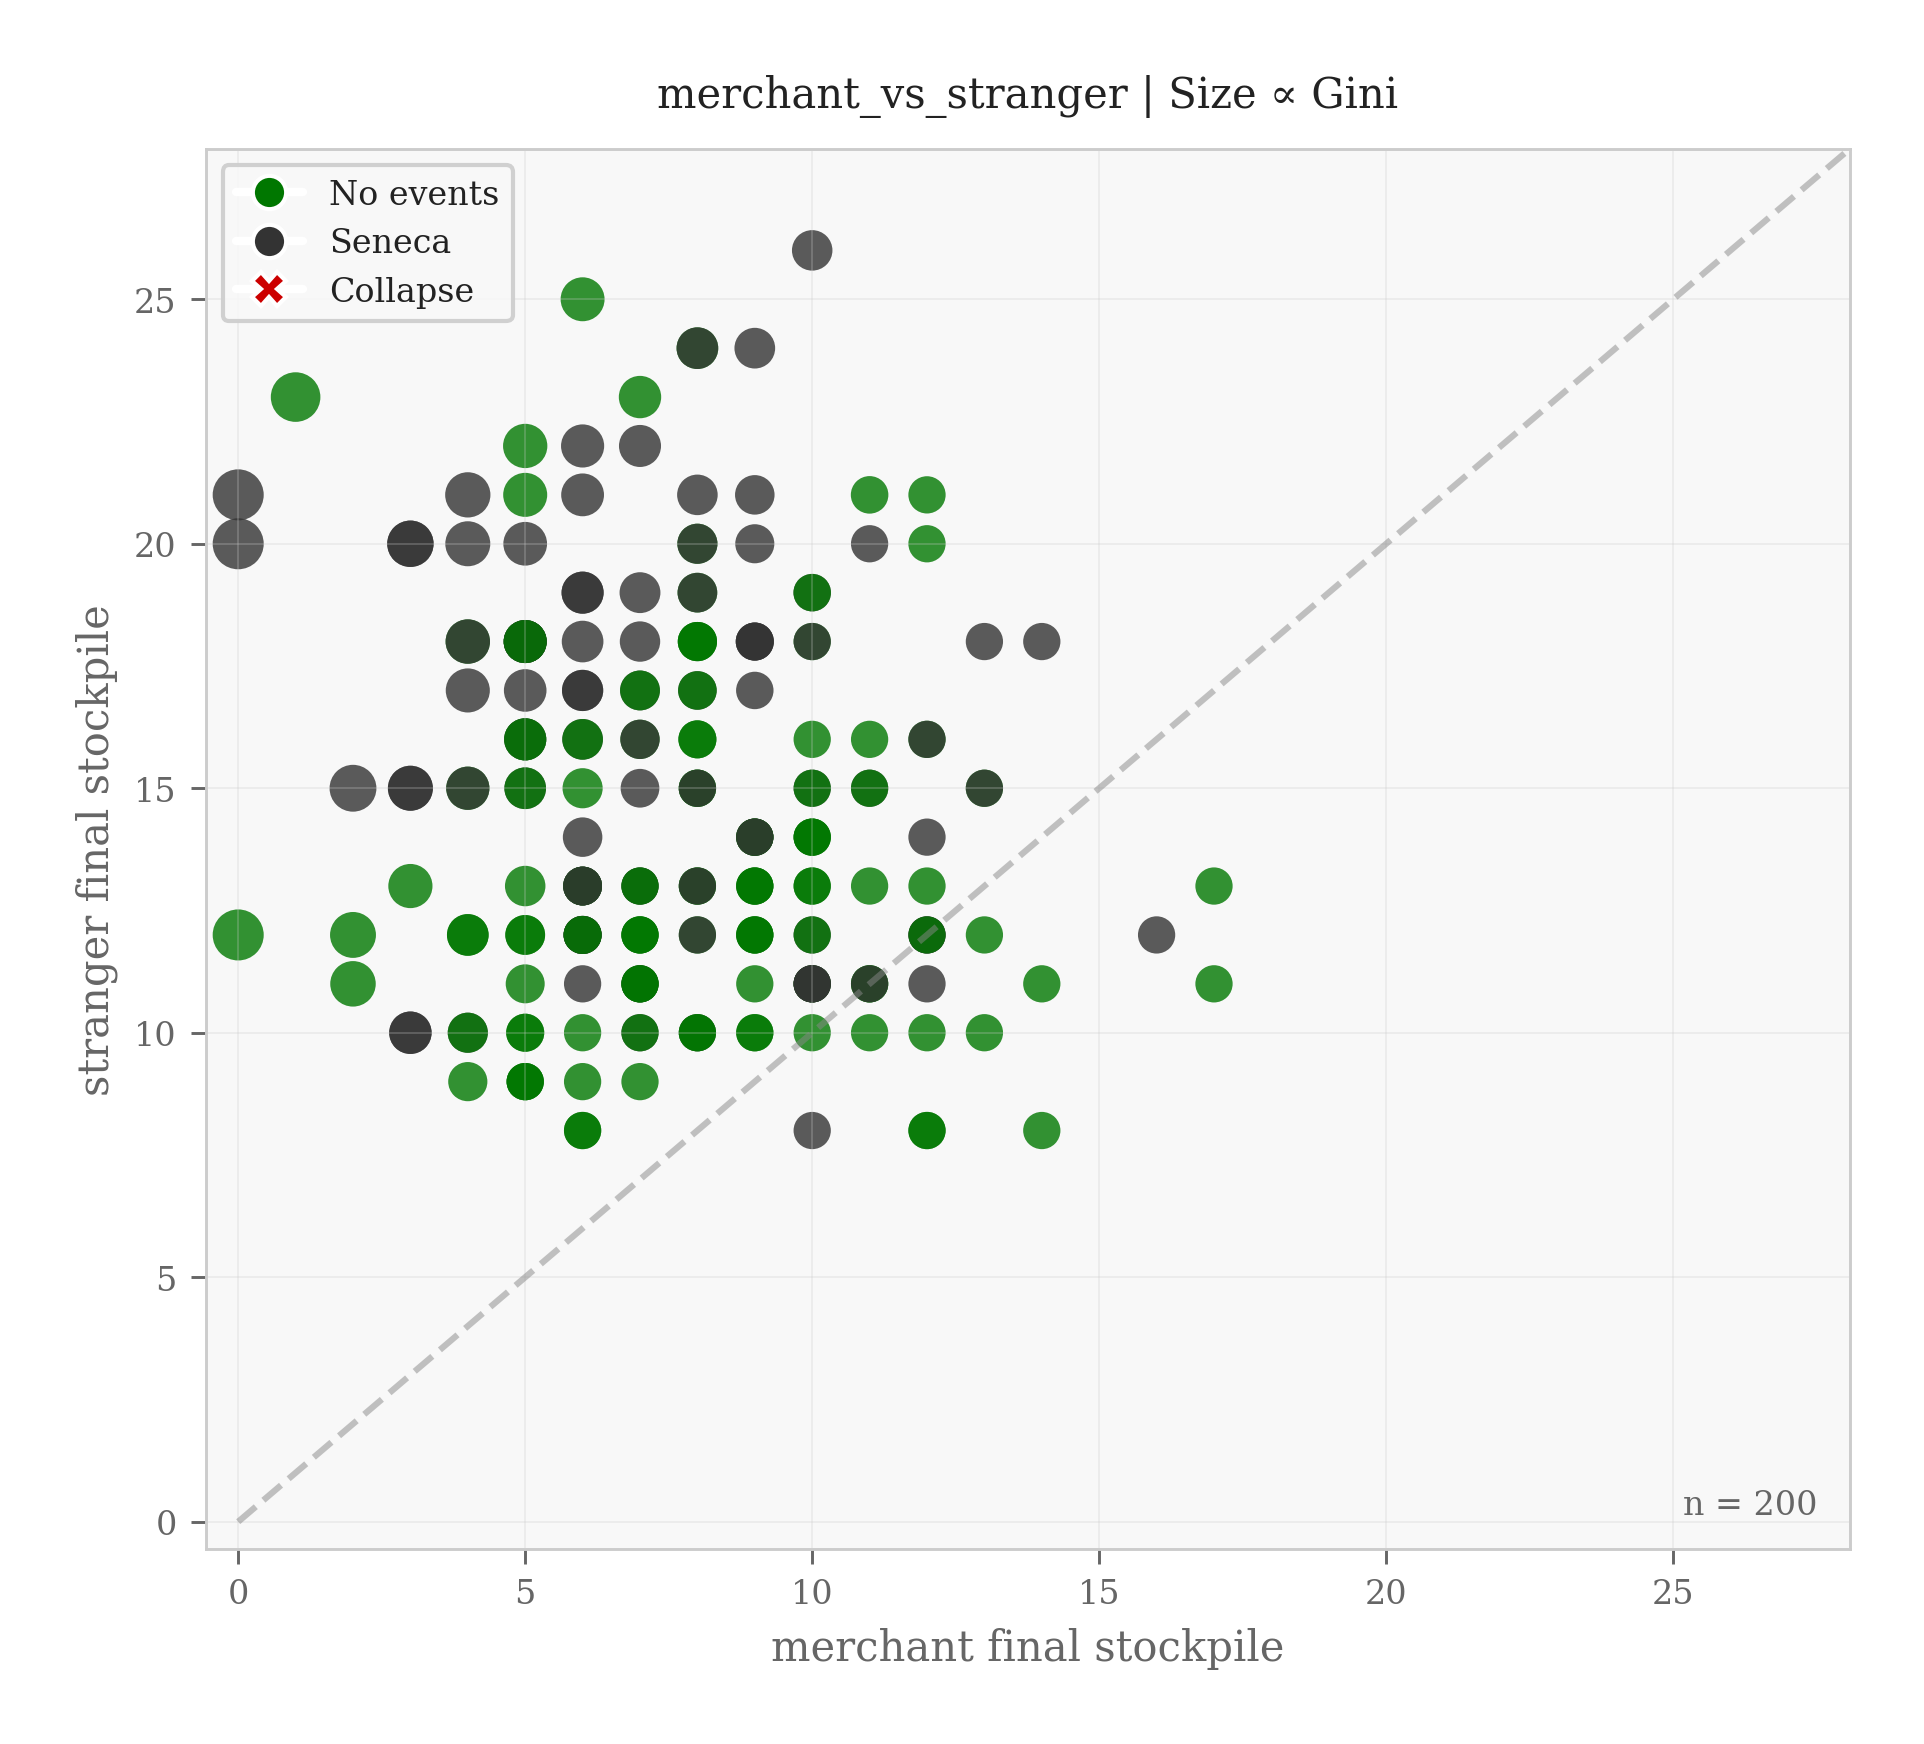
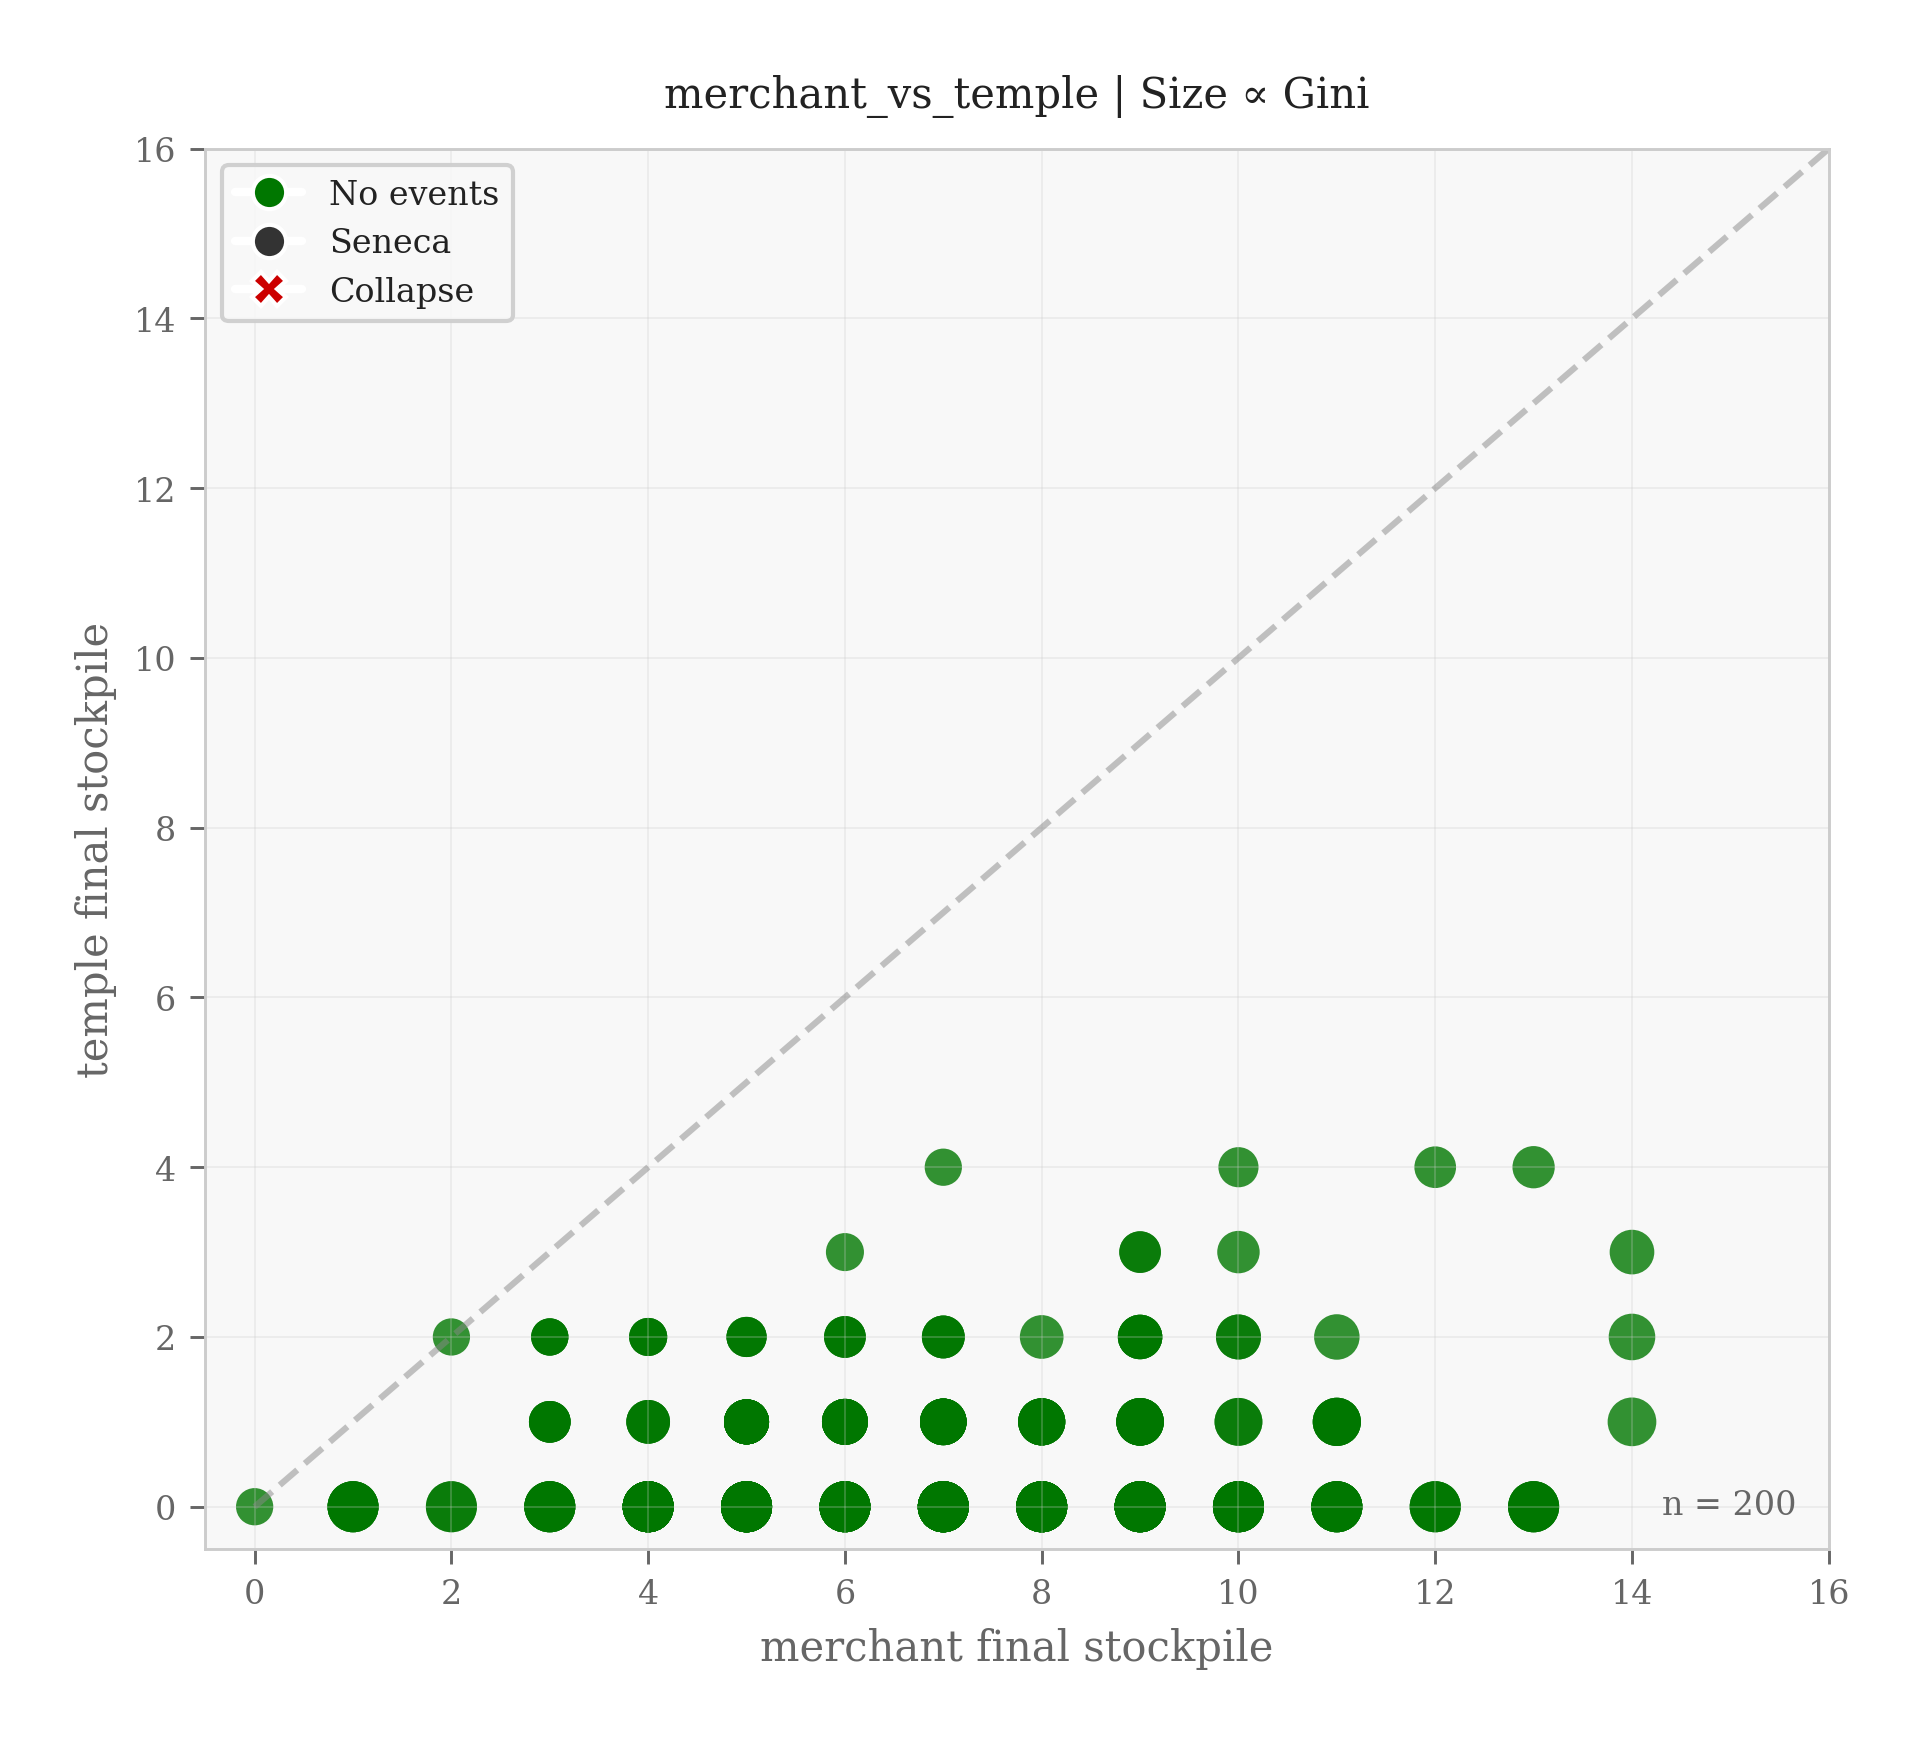
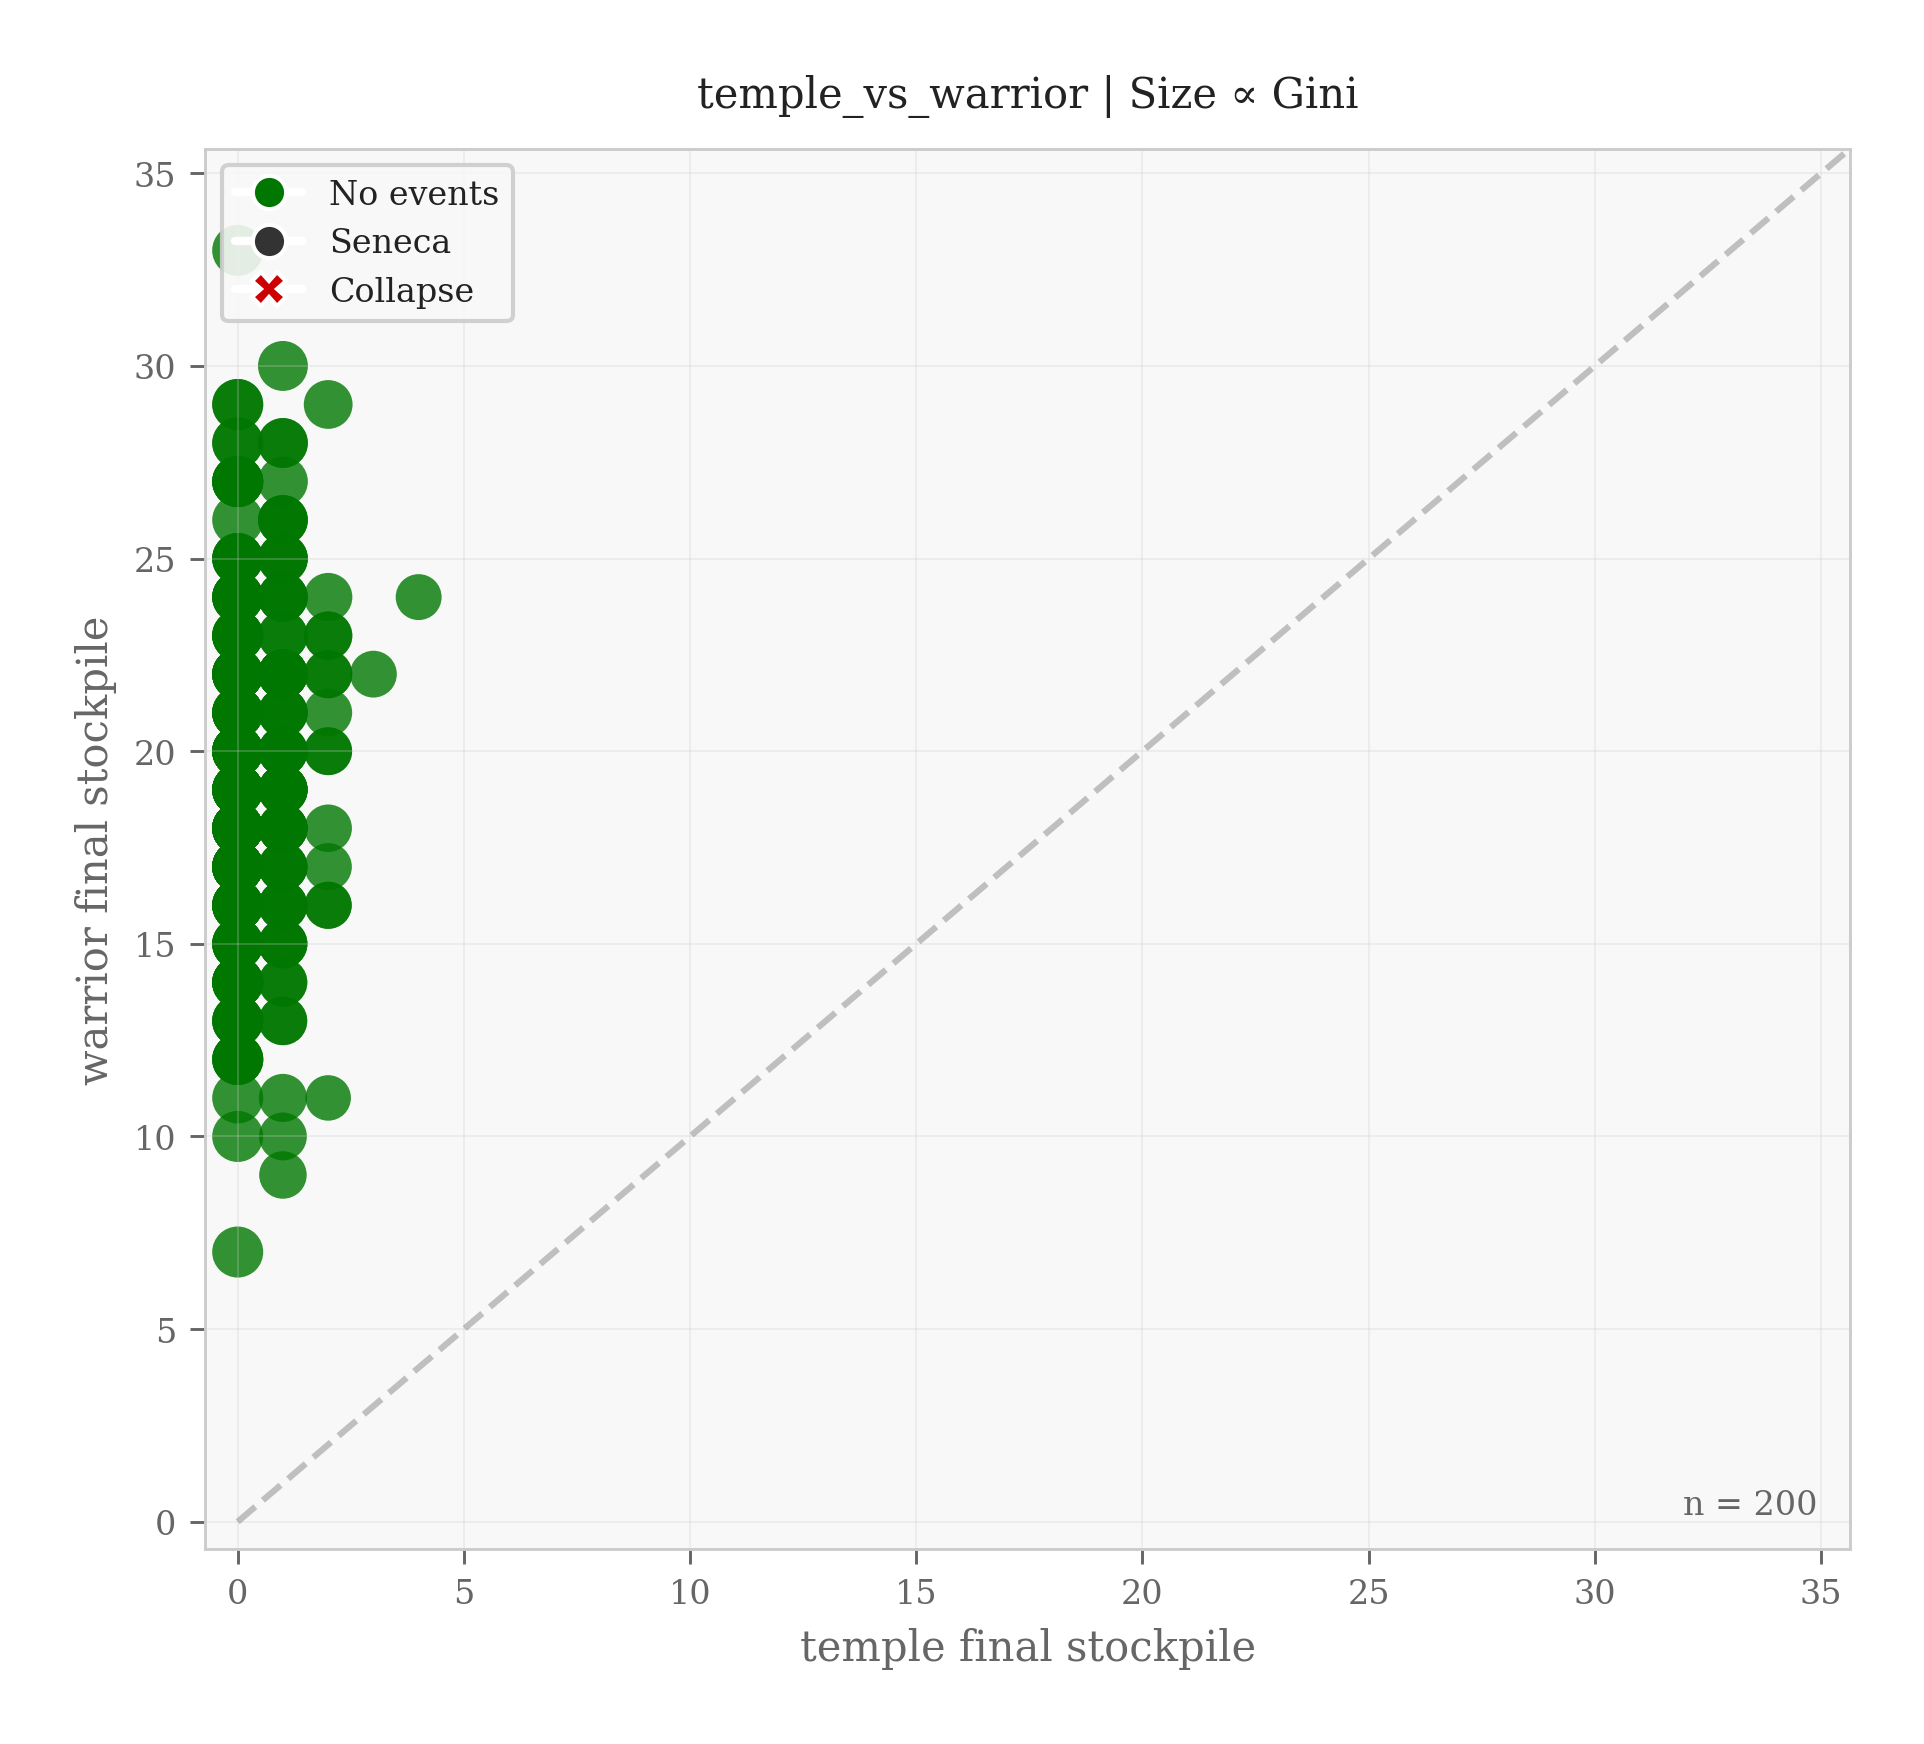
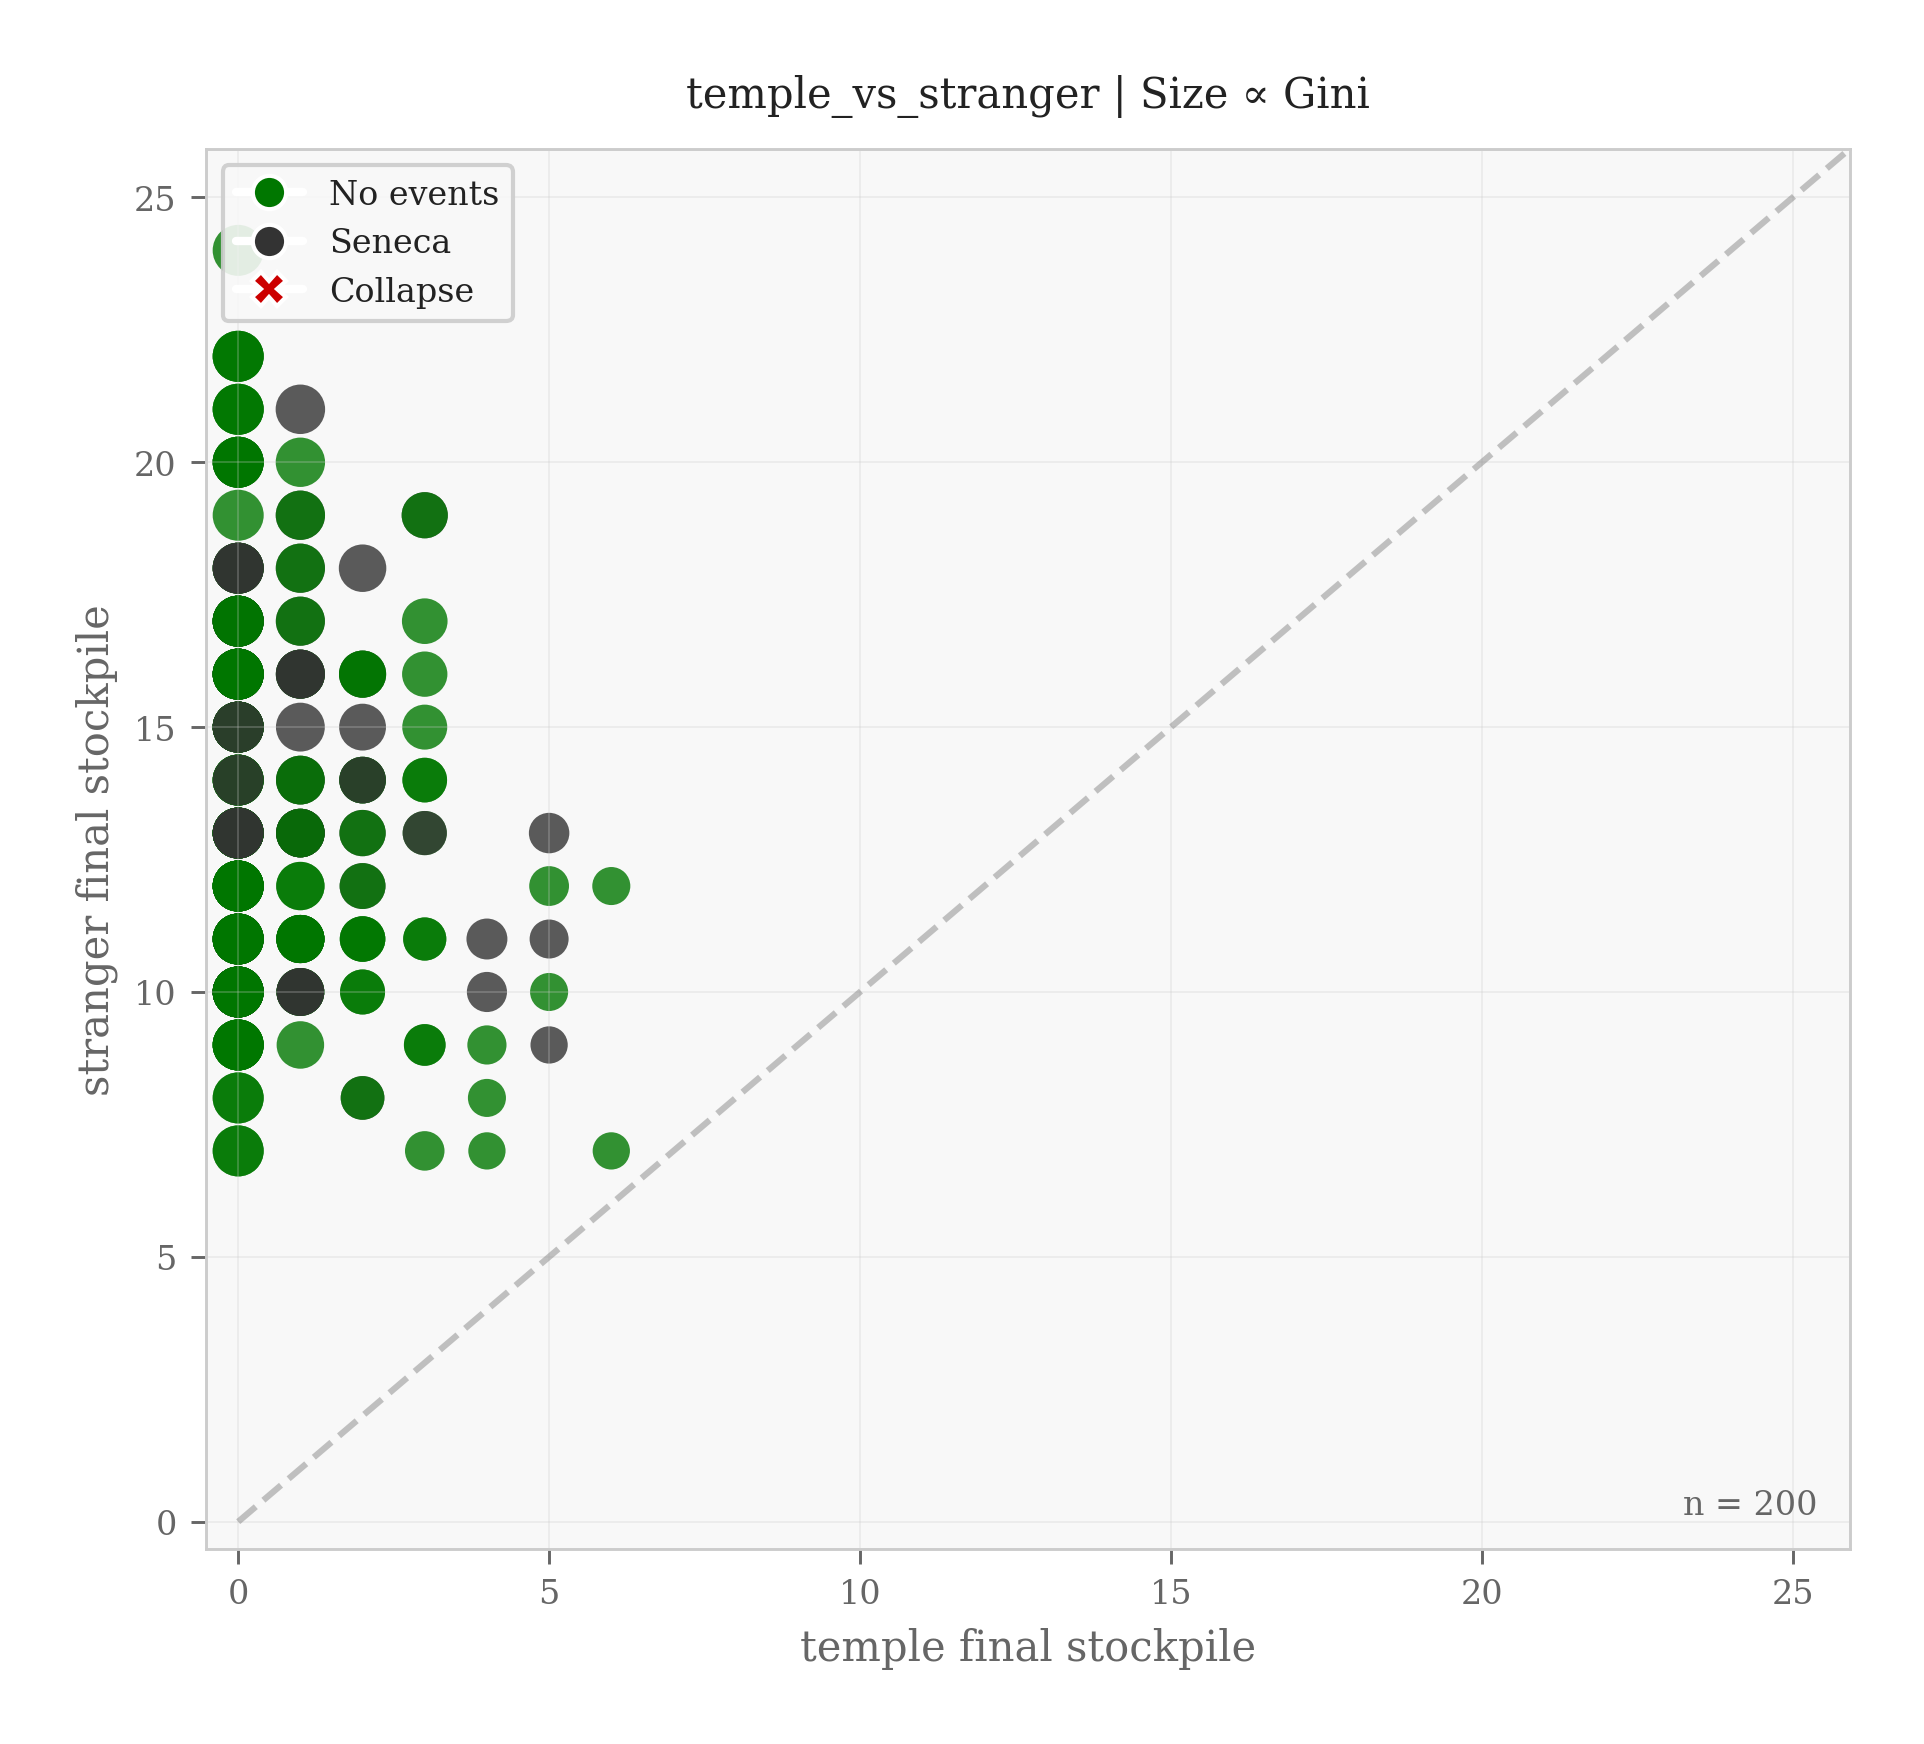
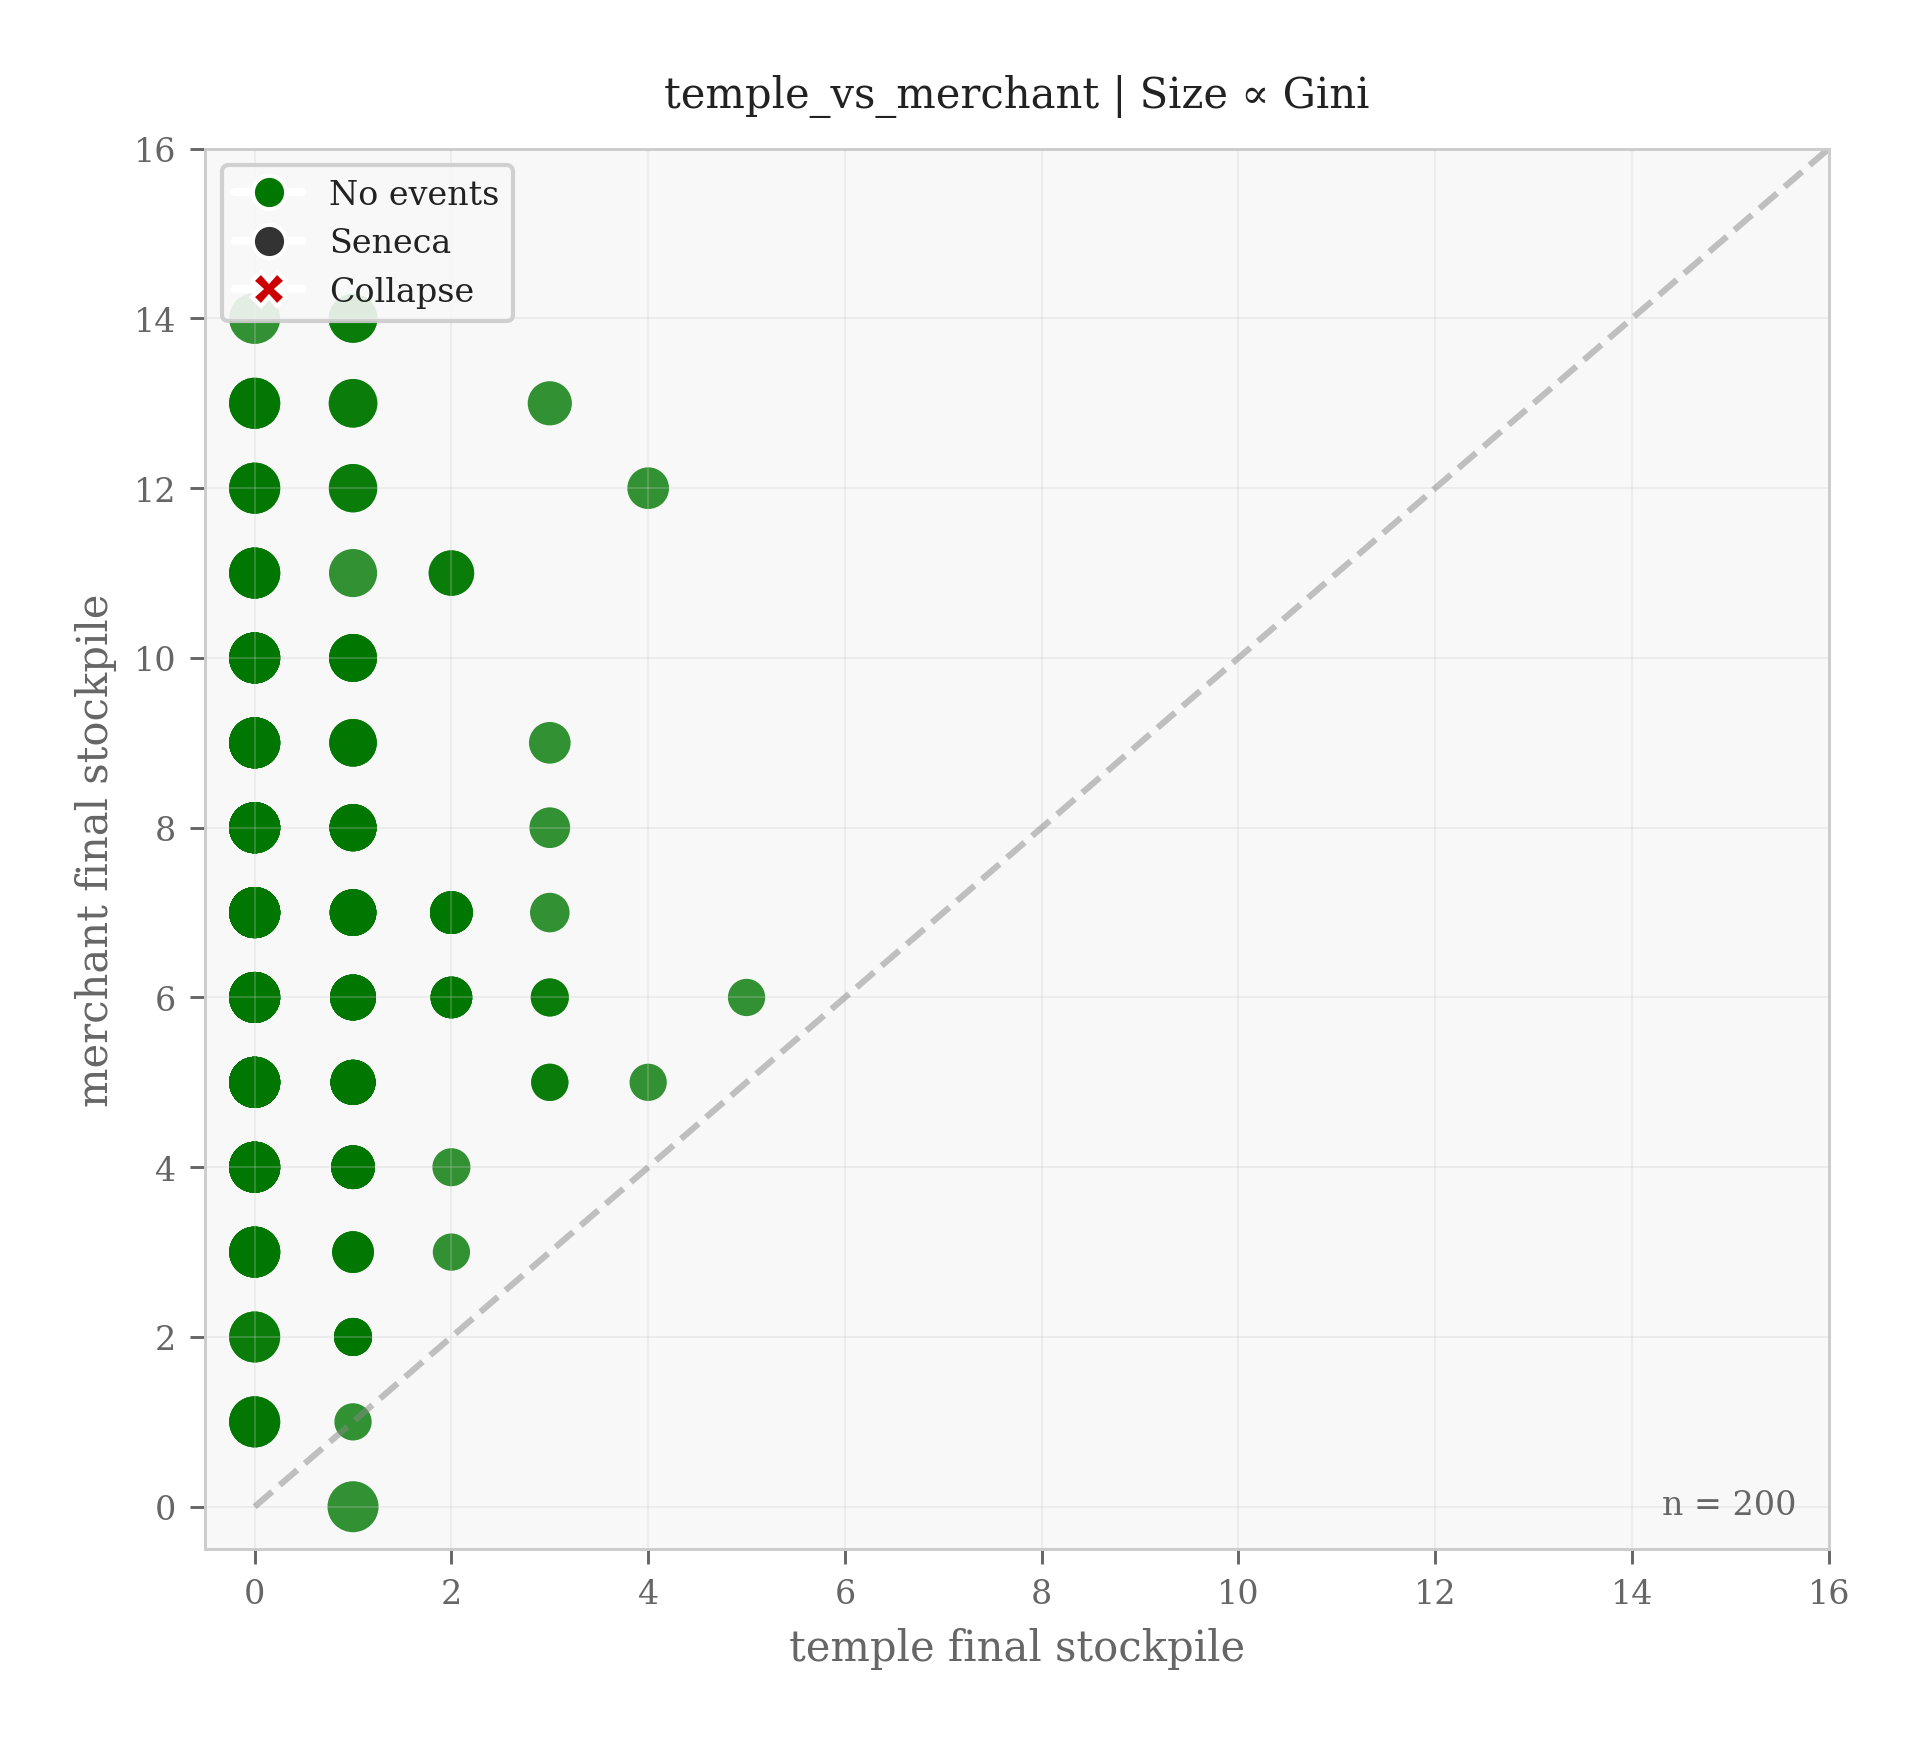
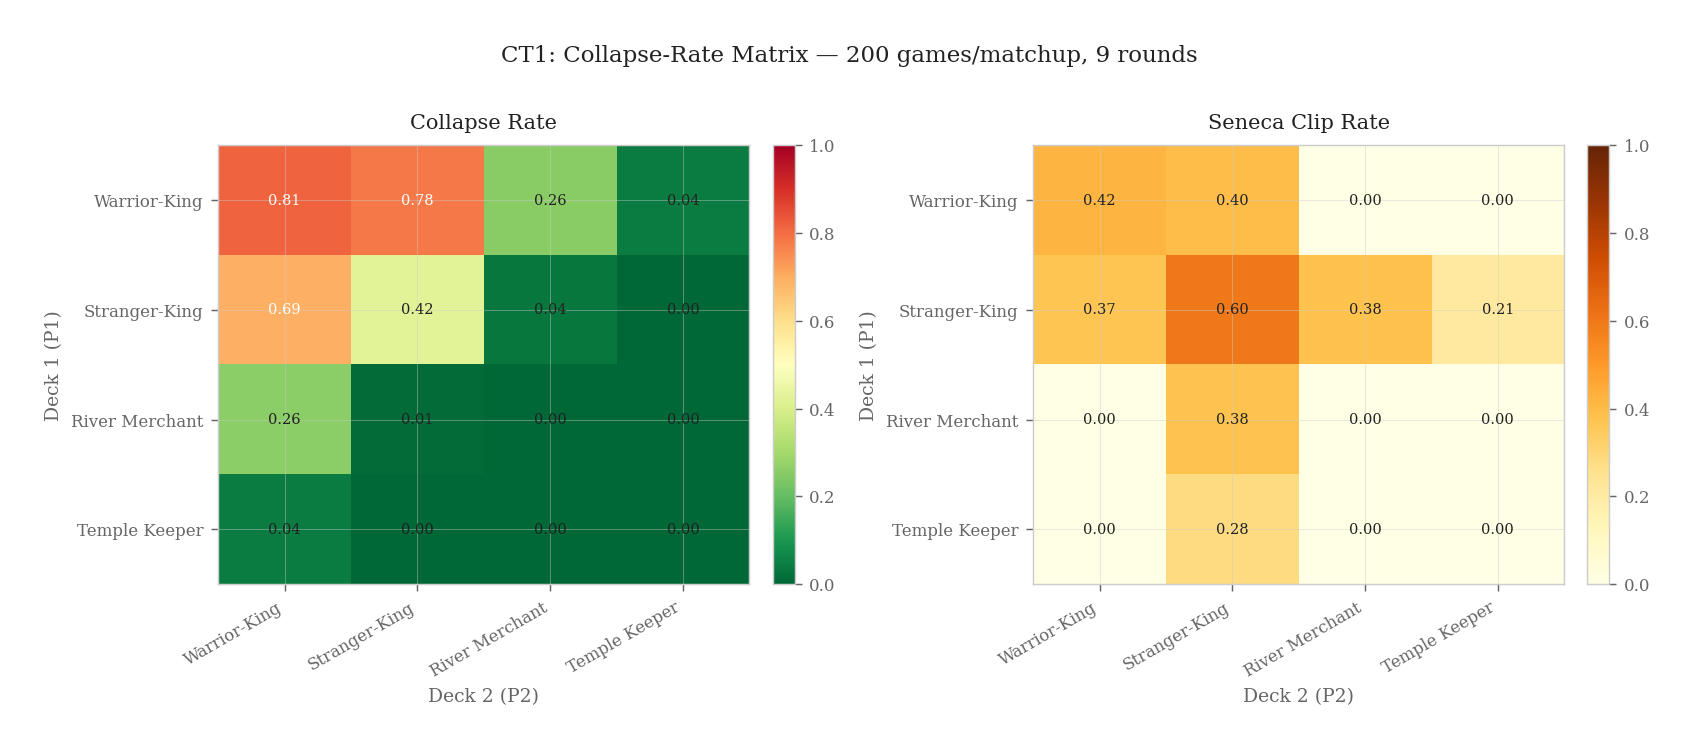
The matrix (Figure 3.9) confirms that collapse is driven almost entirely by the presence of the Warrior-King, mirroring the Arena’s discontinuous threshold (P1). However, unlike the Arena’s binary gate passage (0% or 100%), the stochastic Forest Die introduces a probabilistic collapse frontier: Warrior vs. Warrior yields an 81.5% collapse rate, leaving an 18.5% survival probability driven by favourable reserve rolls. This gradation refines RQ1: the threshold is not binary but probabilistically dominant — the Warrior-King makes collapse near-certain, not inevitable in every single game.
3.2.2 CT2 — Game-Length Sweep: Temporal Horizon and Collapse
The platform’s regen-rate sweep (P2) tests whether environmental generosity offsets aggression; in the card game, the closest analogue is game length — more rounds give the Forest Die more opportunities to trigger, but also give the Temple Keeper more rounds to heal. We swept maximum game length at 9, 12, and 15 rounds for all six unordered archetype pairs.
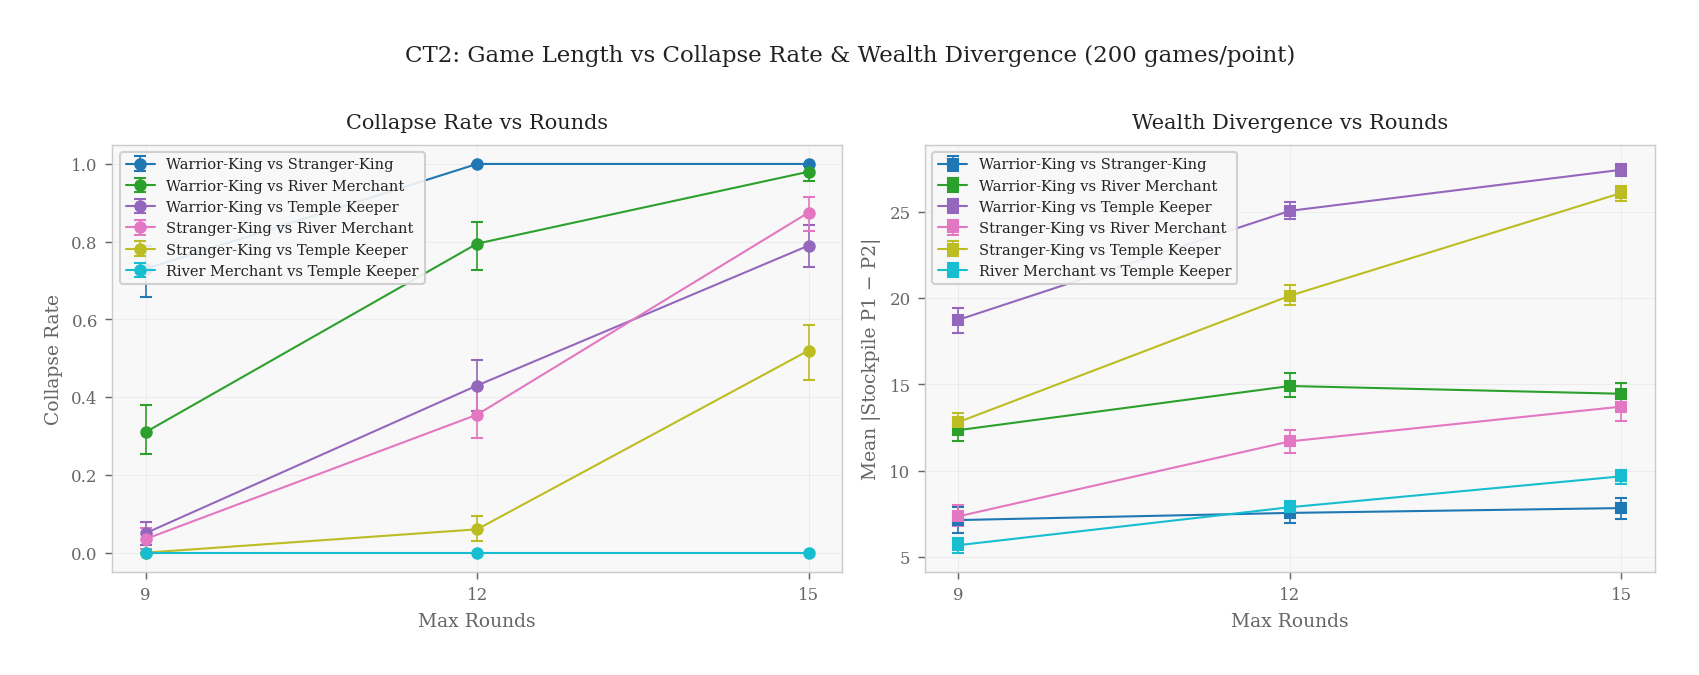
Game length acts as an amplifier of structural asymmetries (Figure 3.10). The Temple Keeper can sustain the forest in the short term (9 rounds, collapse 0.05), but 15 rounds of steady Warrior-King extraction inevitably overwhelm discrete regeneration (collapse 0.79). Wealth divergence compounds similarly: the stockpile gap grows monotonically with length for all aggressive matchups. This confirms that temporal extension amplifies the extractor’s structural advantage, not the conservator’s: each additional round transfers wealth from the commons to the aggressive player, compounding the capacity-feedback loop rather than giving conservation time to catch up.
3.3 Structural Asymmetries and Institutional Limits (RQ1–RQ2)
Having established that the collapse threshold is discontinuous and independent of pool size or regeneration rate within the canonical regime, we next asked whether structural features of the institutional arrangement — initial wealth endowments and turn-order rules — can alter this trajectory. These two experiments test whether the form of inequality or the sequence of power matters once an aggressive agent is present.
P6 — Initial endowment asymmetry. One aggressive agent (a0) was given an initial resource endowment varying from 10 to 120, while all other agents (1 conservative + 1 reactive) started at 30. Since harvest capacity scales with wealth (capacity = 1 + 0.05 \(\times\) w), a wealthier starting position translates directly into higher extraction rates from turn 1. The experiment measures how much initial advantage compounds over the game and whether it affects gate passage or overall welfare.
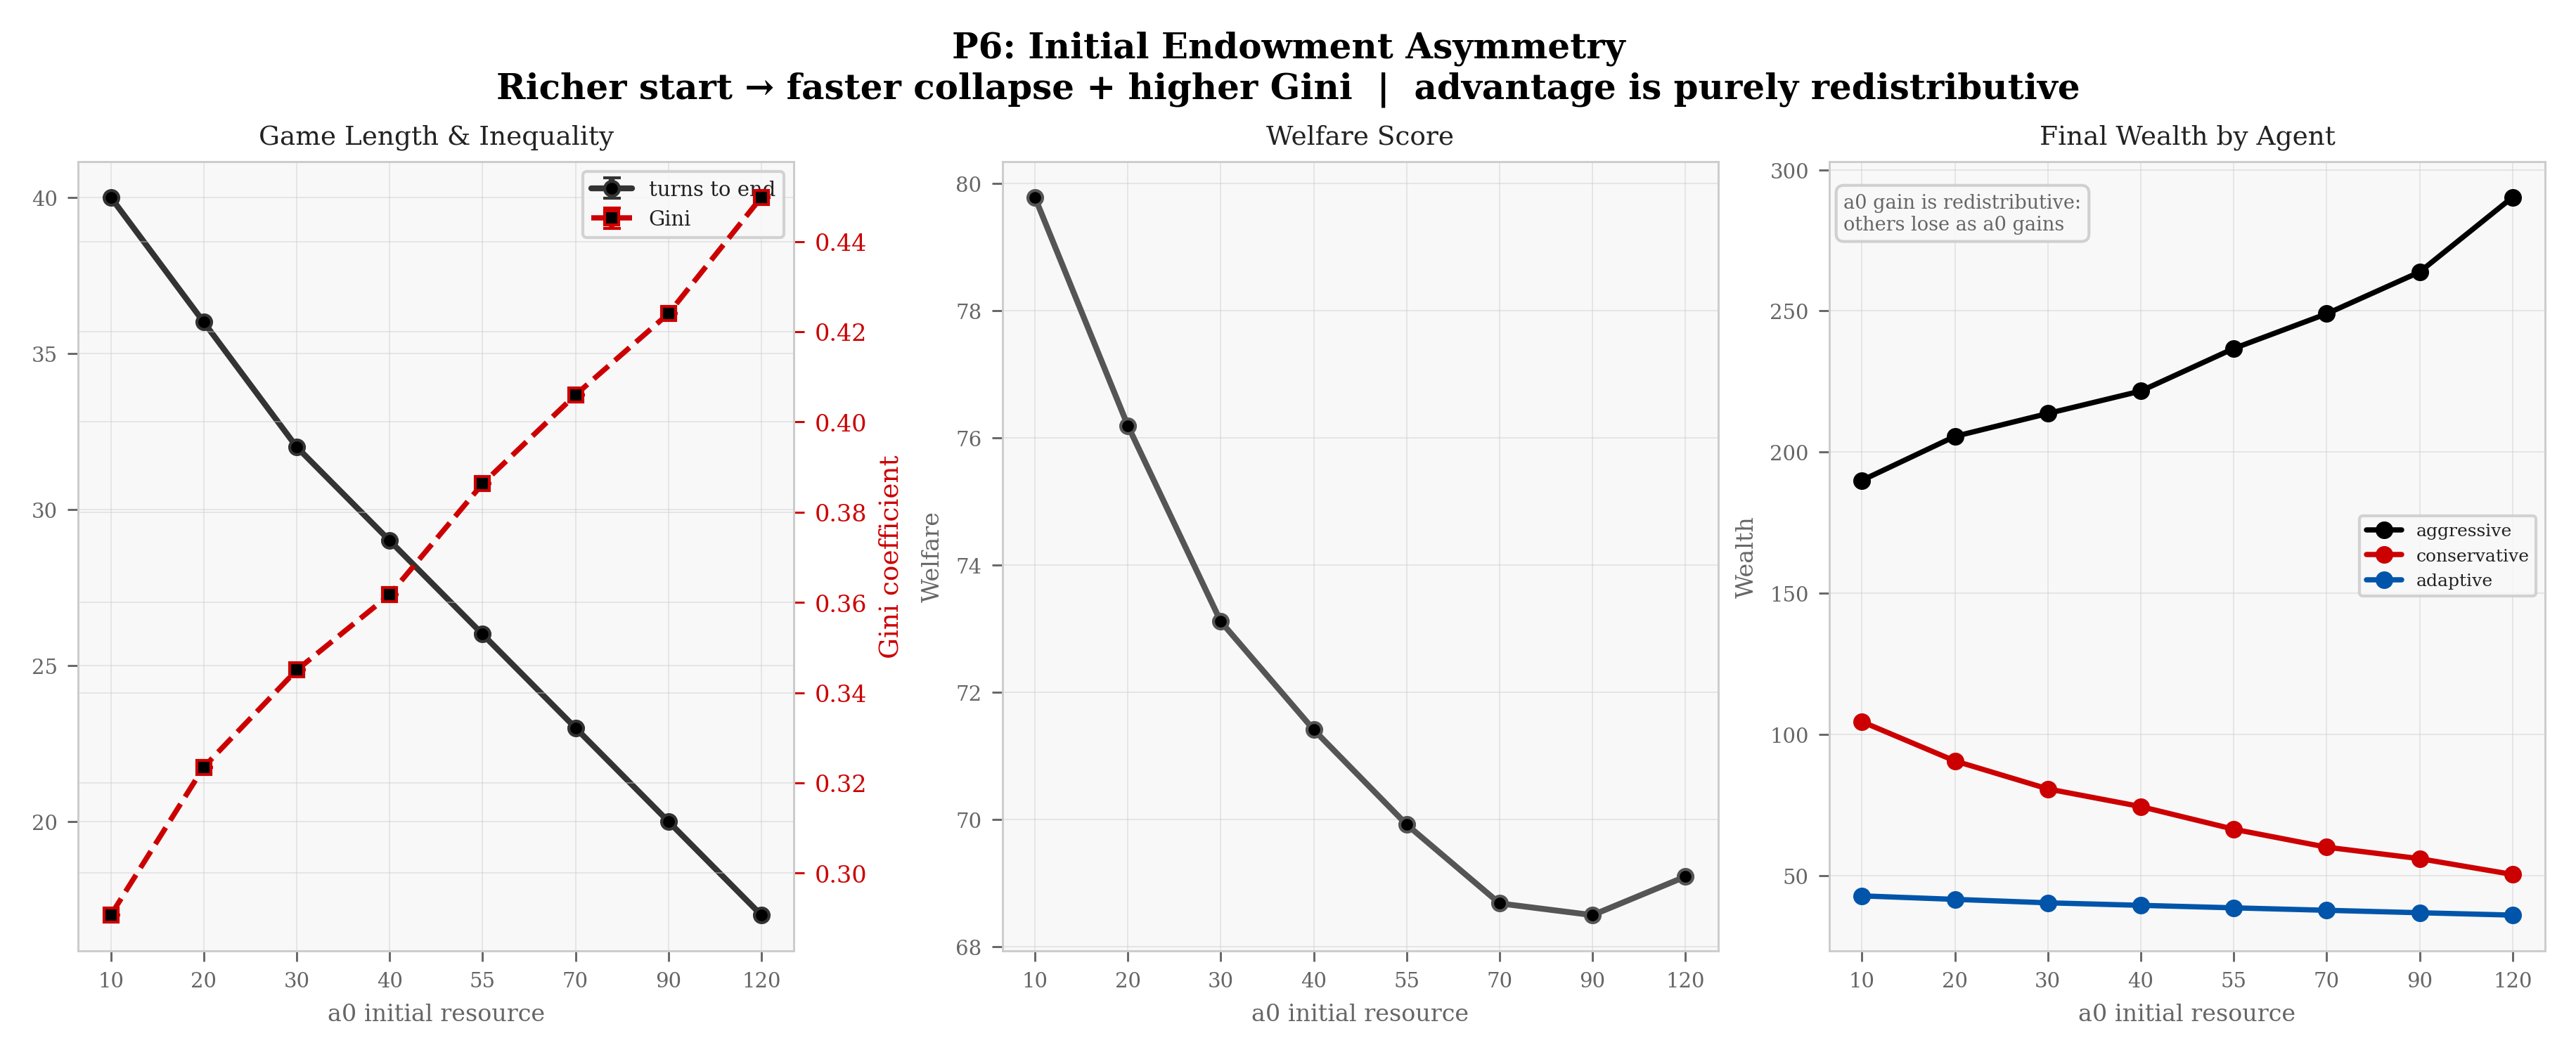
Initial advantage does not create new wealth — it redistributes it (Figure 3.11). As the aggressive agent’s starting endowment rises, conservative and reactive agents’ final wealth declines in near-perfect mirror symmetry. Game length decreases (wealthier agents harvest faster) and Gini rises from ~0.30 to ~0.44, but the gate never passes. The commons under collapse is zero-sum: redistributing its contents does not change the aggregate outcome.
P7 — Scheduler comparison. Three schedulers were compared with a fixed population of 1 aggressive + 3 conservative agents (r = 0.12, 20–30 runs per point): simultaneous (all agents decide in parallel — the baseline closest to continuous-time differential game theory), sequential random (random turn order each round, introduces path dependency), and wealth weighted (richer agents act first, modelling lobbying power and regulatory capture (Dal Bó 2006)). The experiment tests whether turn order, a structural feature of the institutional arrangement, significantly alters outcomes beyond what strategy composition determines.
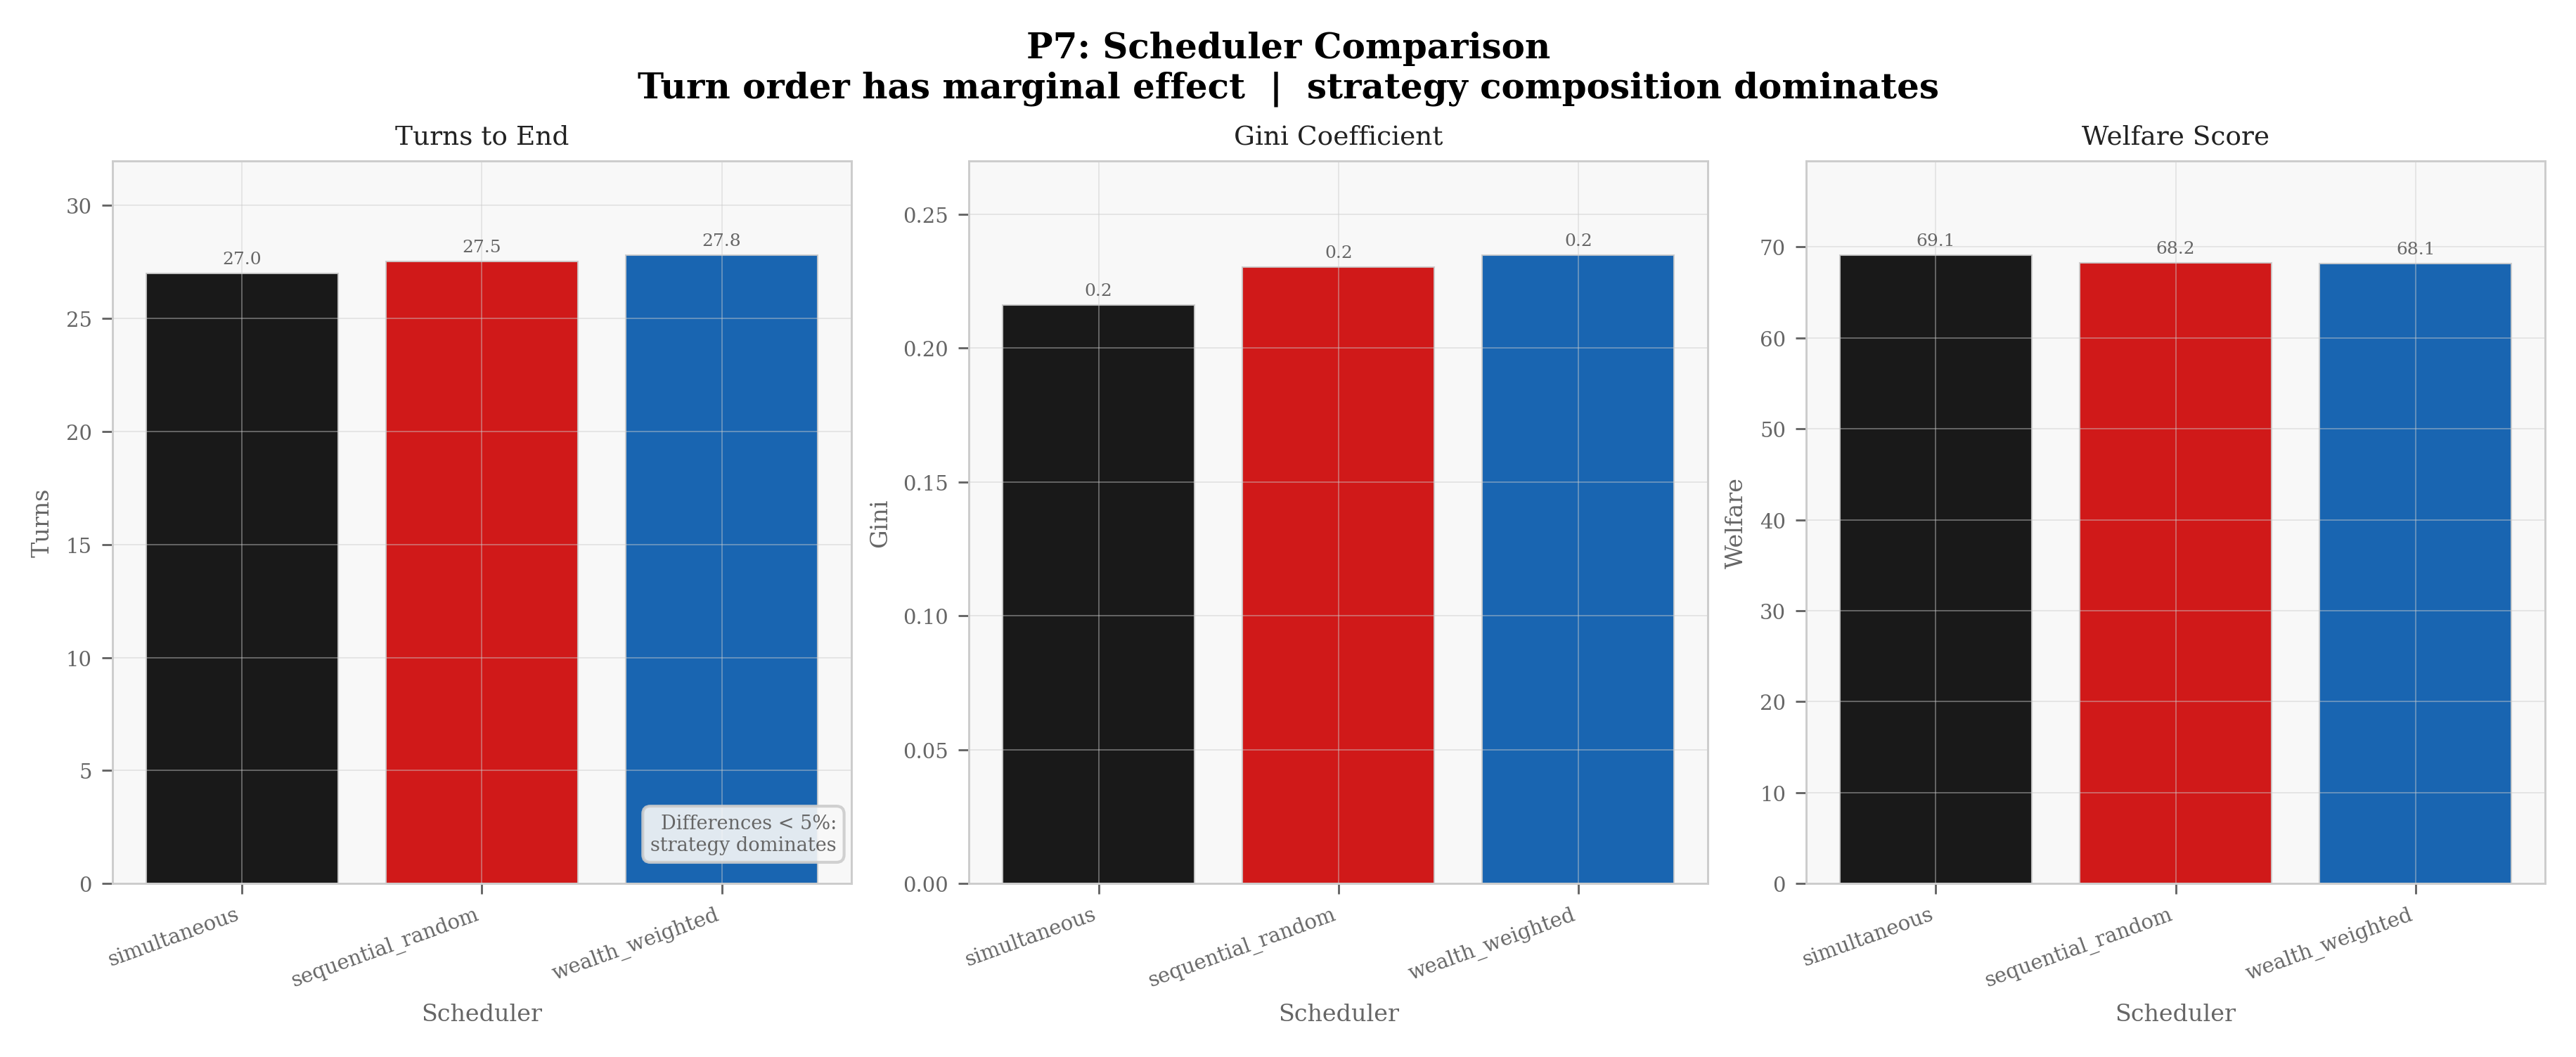
All three schedulers produce qualitatively identical outcomes (Figure 3.12): gate pass rate 0%, game length ~27–28 turns, Gini 0.216–0.235. The wealth-weighted scheduler — which gives first-mover advantage to the richest agent — does not materially worsen outcomes. Strategy composition dominates institutional turn-order rules. Permutation testing (B5, Appendix B) formally confirms this: welfare differences across schedulers are not statistically distinguishable (p = 1.000, 10000 permutations), and neither are game-length differences (p = 1.000). The observed spread of under 1 welfare point and under 1 turn falls entirely within chance variation.
3.4 The Epistemic Dilemma: Adaptation and Observability (RQ2–RQ3)
If institutional design cannot save the commons once an aggressive agent is present, can information or intelligence do so? The following two experiments test two intuitive mitigations: letting agents adapt their behaviour to the resource state (P8), and varying how accurately agents observe that state (P9). Both reveal counterintuitive results where locally rational responses produce globally detrimental outcomes.
P8 — Reactive vs. conservative effectiveness. We compared reactive vs. conservative as the alternative non-aggressive strategy in a mixed pool (1 aggressive + 3 non-aggressive agents) across regen rates \(r \in \{0.10, 0.14, 0.20\}\). Three compositions were tested: all-reactive, all-conservative, and mixed. The reactive agent (referred to as AdaptiveAgent in the codebase) scales harvest based on the observed stock trend. The experiment tests whether this locally responsive strategy translates into better collective outcomes than an unconditionally fixed moderate harvest.
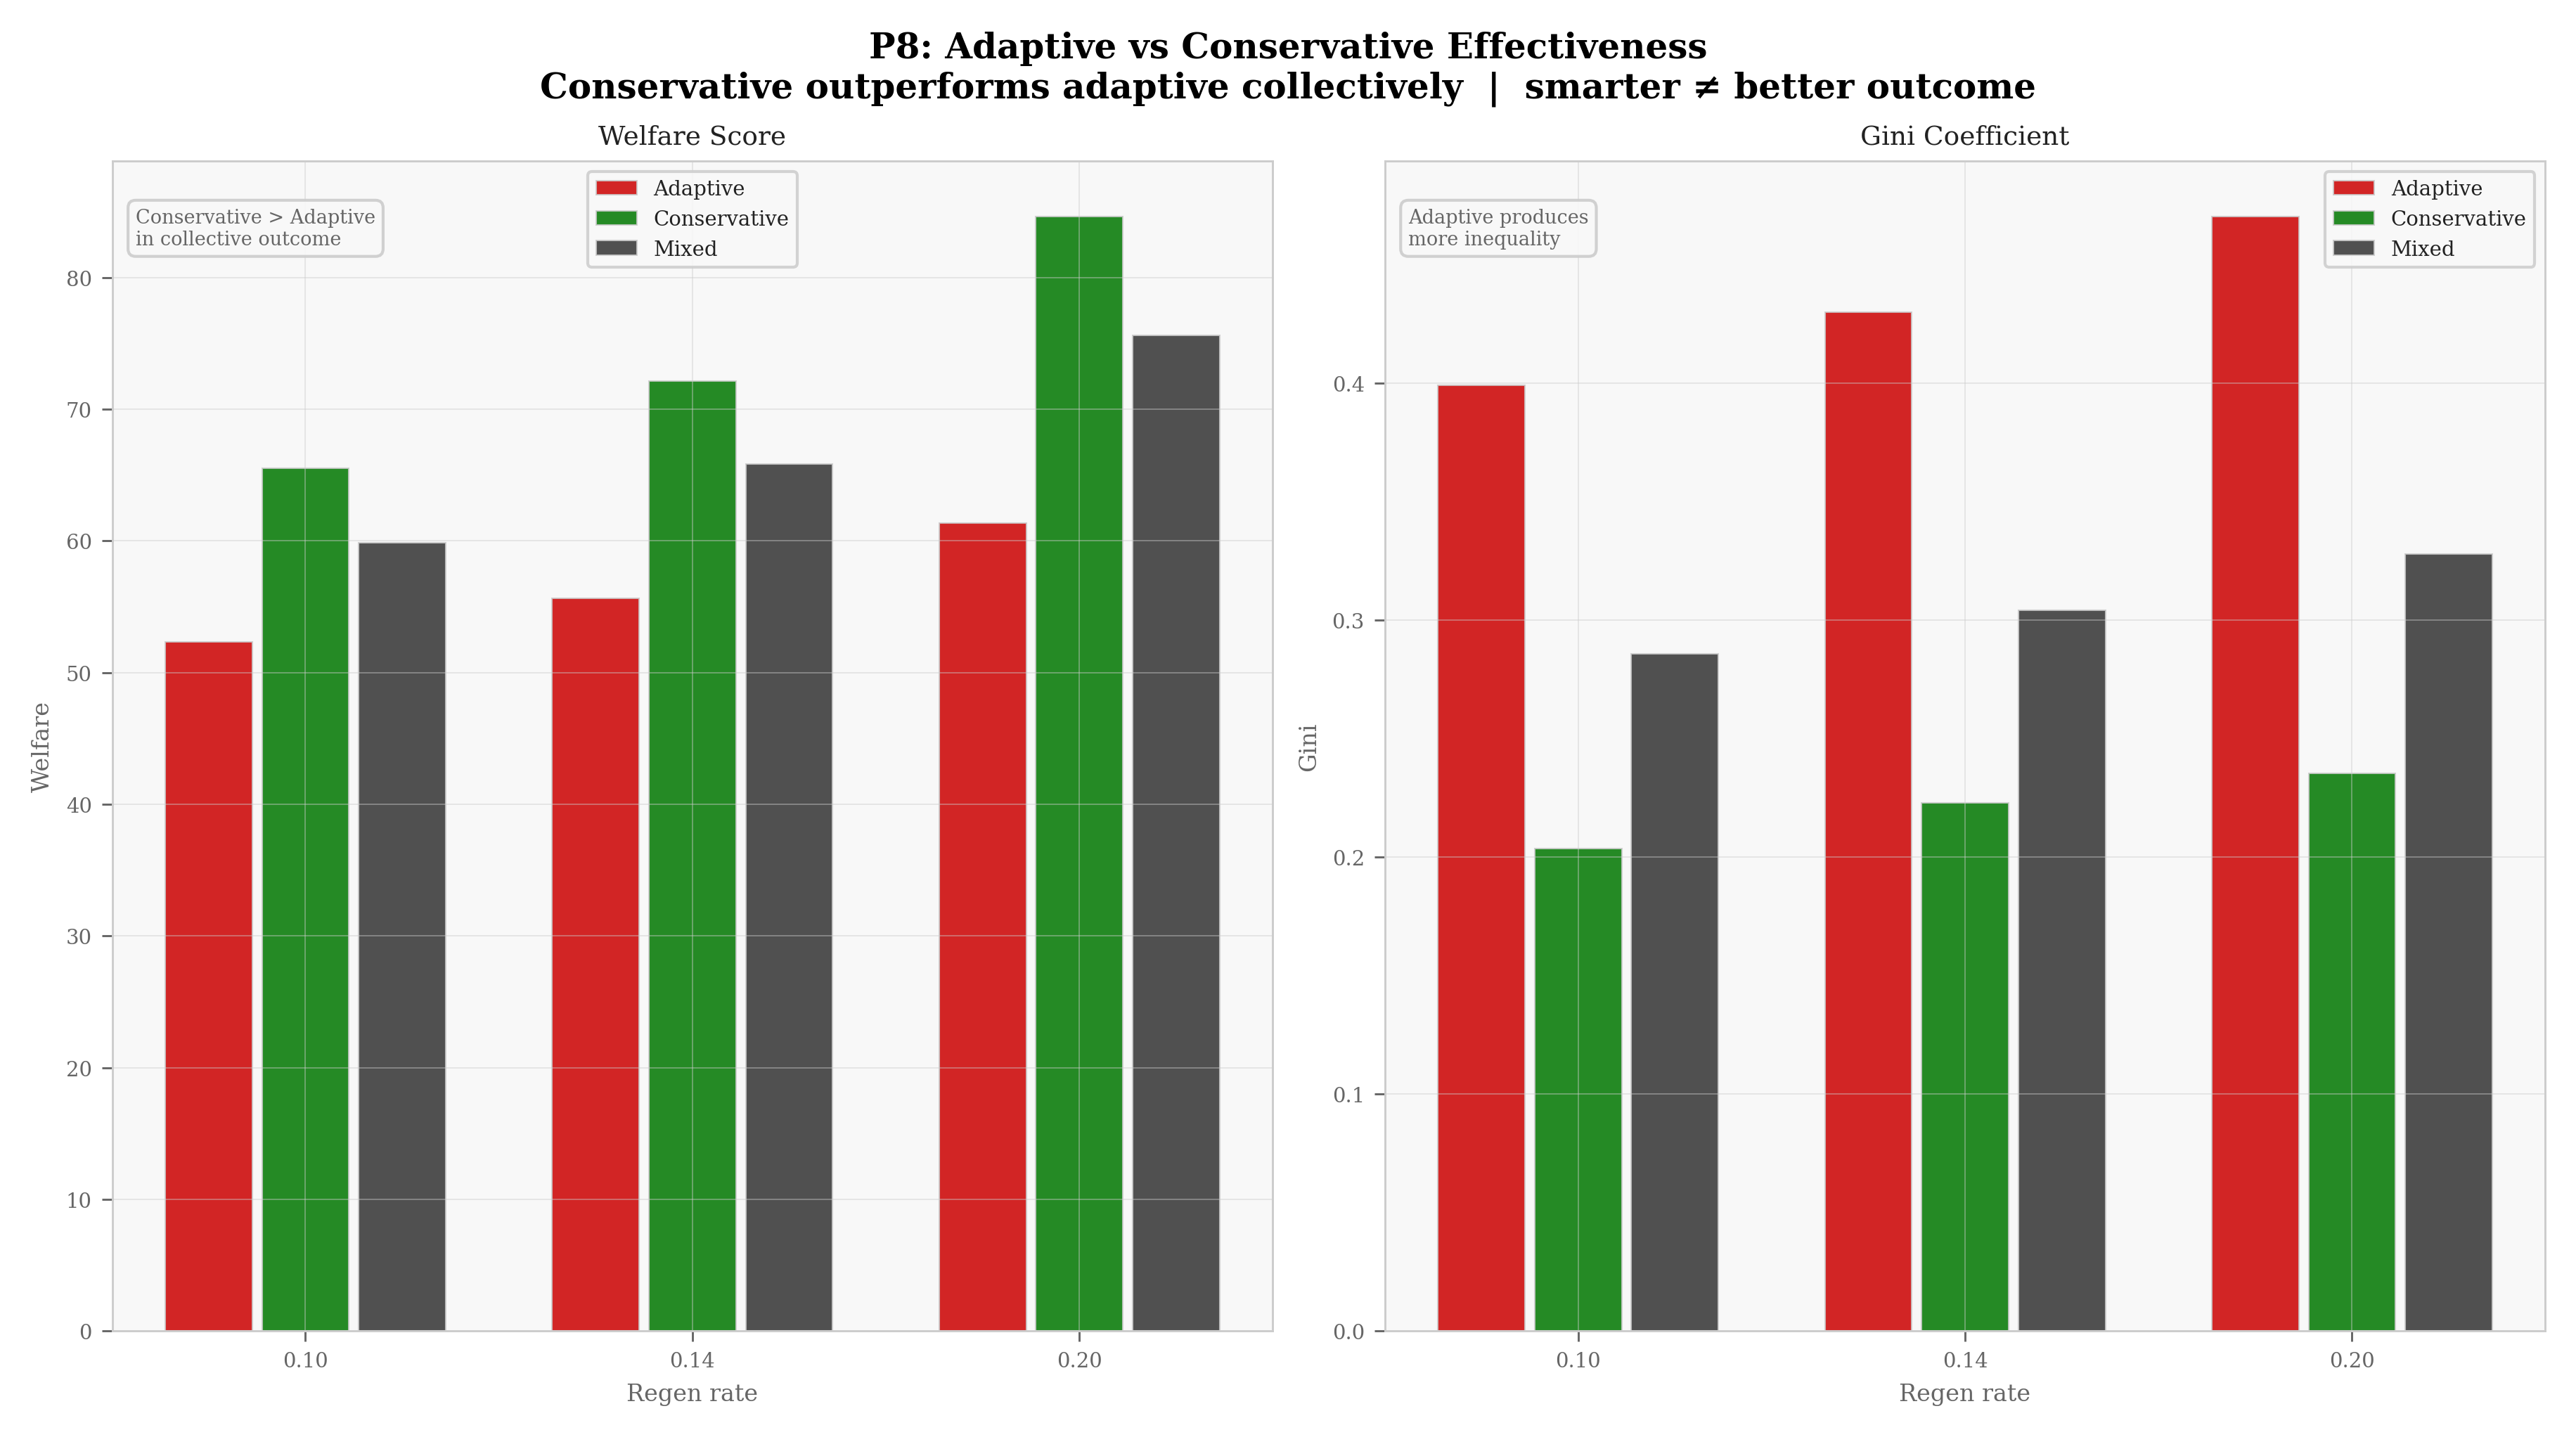
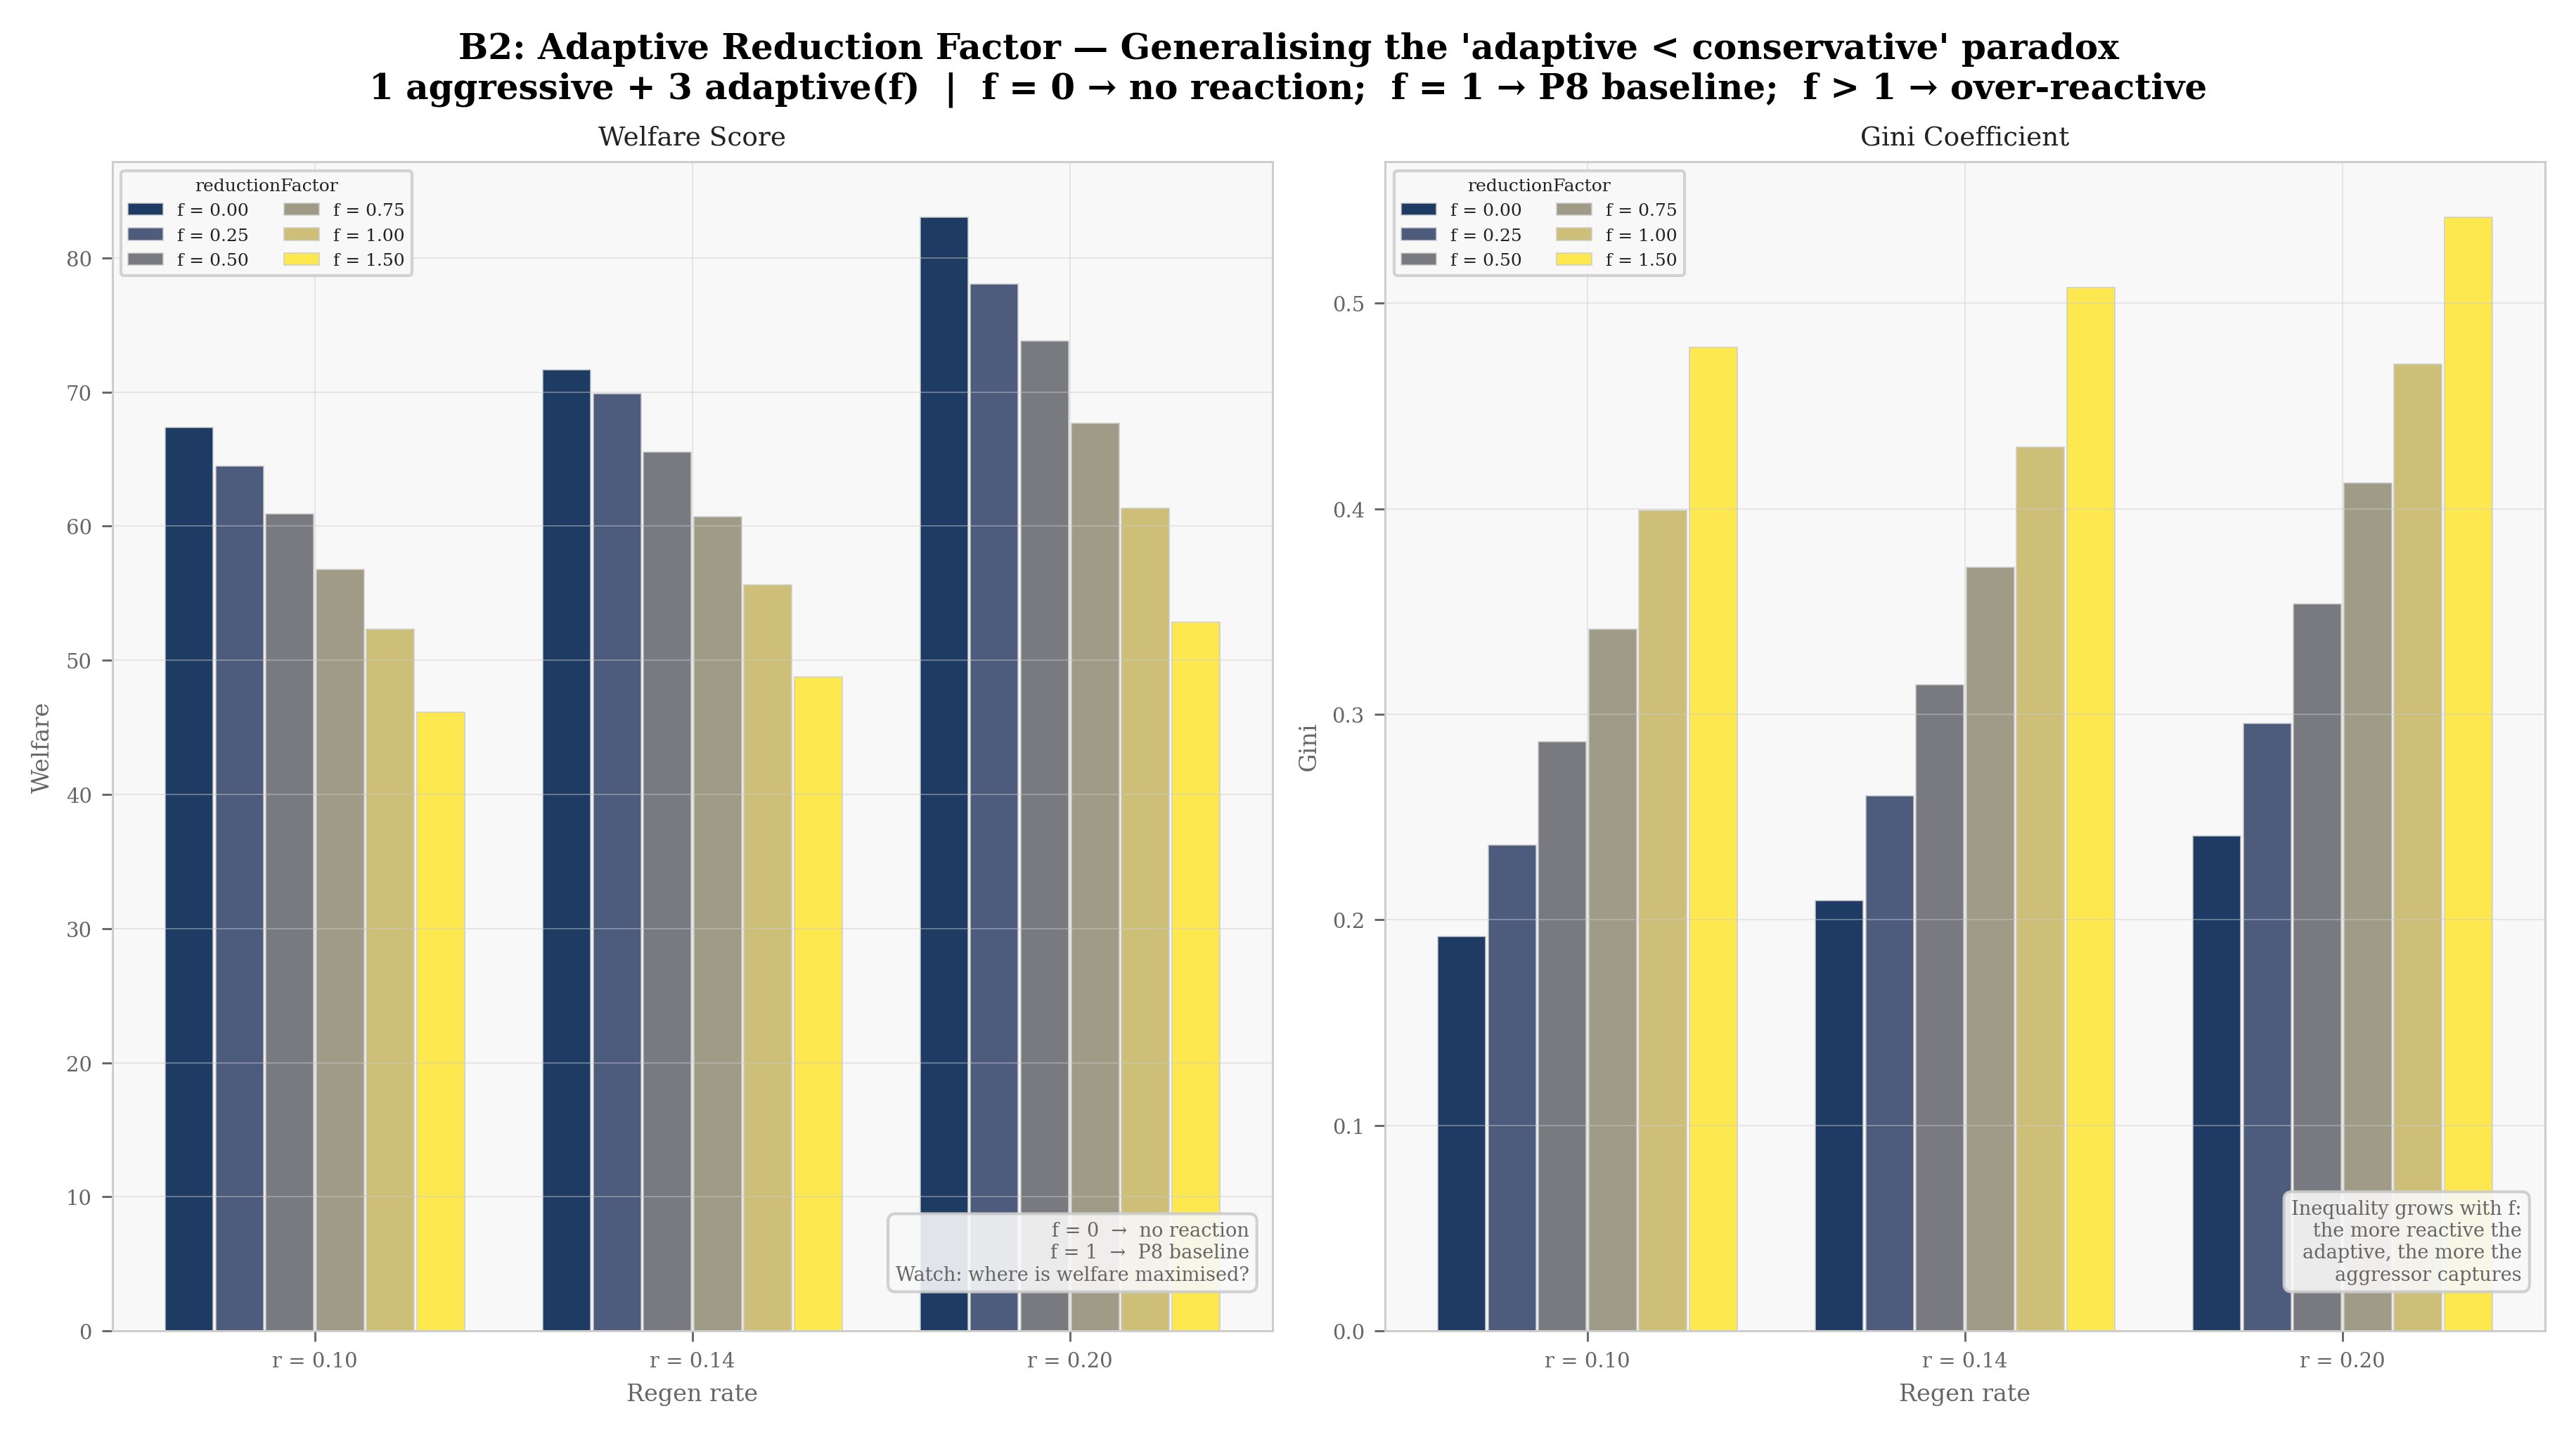
Conservative-only pools yield higher welfare and lower inequality than reactive-only pools at all tested regen rates (Figure 3.13). This constitutes the reactive < conservative effect — a predictable strategic externality in which the individually reactive strategy produces worse collective outcomes. (We adopt reactive < conservative as the canonical name of the effect throughout this paper; earlier versions of the framework — and the AdaptiveAgent class in the codebase — referred to it as adaptive < conservative.) The mechanism is a strategic vacuum — distinct from the card-game’s literal Vacuum Effect (§2.2), but sharing the same logic: when a reactive agent detects falling stock and reduces harvest, it cedes extraction capacity to the aggressive agent. In the Arena this concession is implicit (no rule transfers the reactive’s foregone unit to the aggressor); the card-game’s Vacuum Effect reifies the same exploitation as an explicit transfer of one cedar to the richest player. Conservative agents, by maintaining a fixed moderate harvest regardless of stock trends, do not create this exploitable gap. Crucially, the reactive agent adapts to ecological signals — the resource level — but not to other agents’ behaviour: it has no game-theoretic awareness of the aggressor’s strategy. This purely ecological adaptation, in the absence of social or strategic response, is structurally a collective liability. Supplement B2 (Appendix B) quantifies how this effect scales with the strength of the reactive response: a sweep of the reductionFactor \(f \in [0, 1.5]\) reveals that welfare declines monotonically with \(f\) at all tested regen rates (slopes: \(-14.6\) at \(r = 0.10\), \(-16.2\) at \(r = 0.14\), \(-20.6\) at \(r = 0.20\); 95% bootstrap CIs all exclude zero). Every degree of reactive adaptation incurs a welfare cost proportional to the harvest space conceded to the aggressor (Figure 3.14).
P9 — Observability noise. Gaussian noise was added to the commonsStock observation at levels \(\sigma/\mu \in \{0.0, 0.05, 0.1, 0.2, 0.35, 0.5\}\), with a separate condition for complete hiding (stock invisible). Population: 1 aggressive + 2 conservative + 1 reactive (r = 0.12). The hypothesis is that noise reduces aggressive exploitation (the aggressive agent perceives a lower stock and reduces demand) but also impairs reactive agent effectiveness (the reactive agent cannot reliably detect trends). A welfare-optimal noise level is predicted.
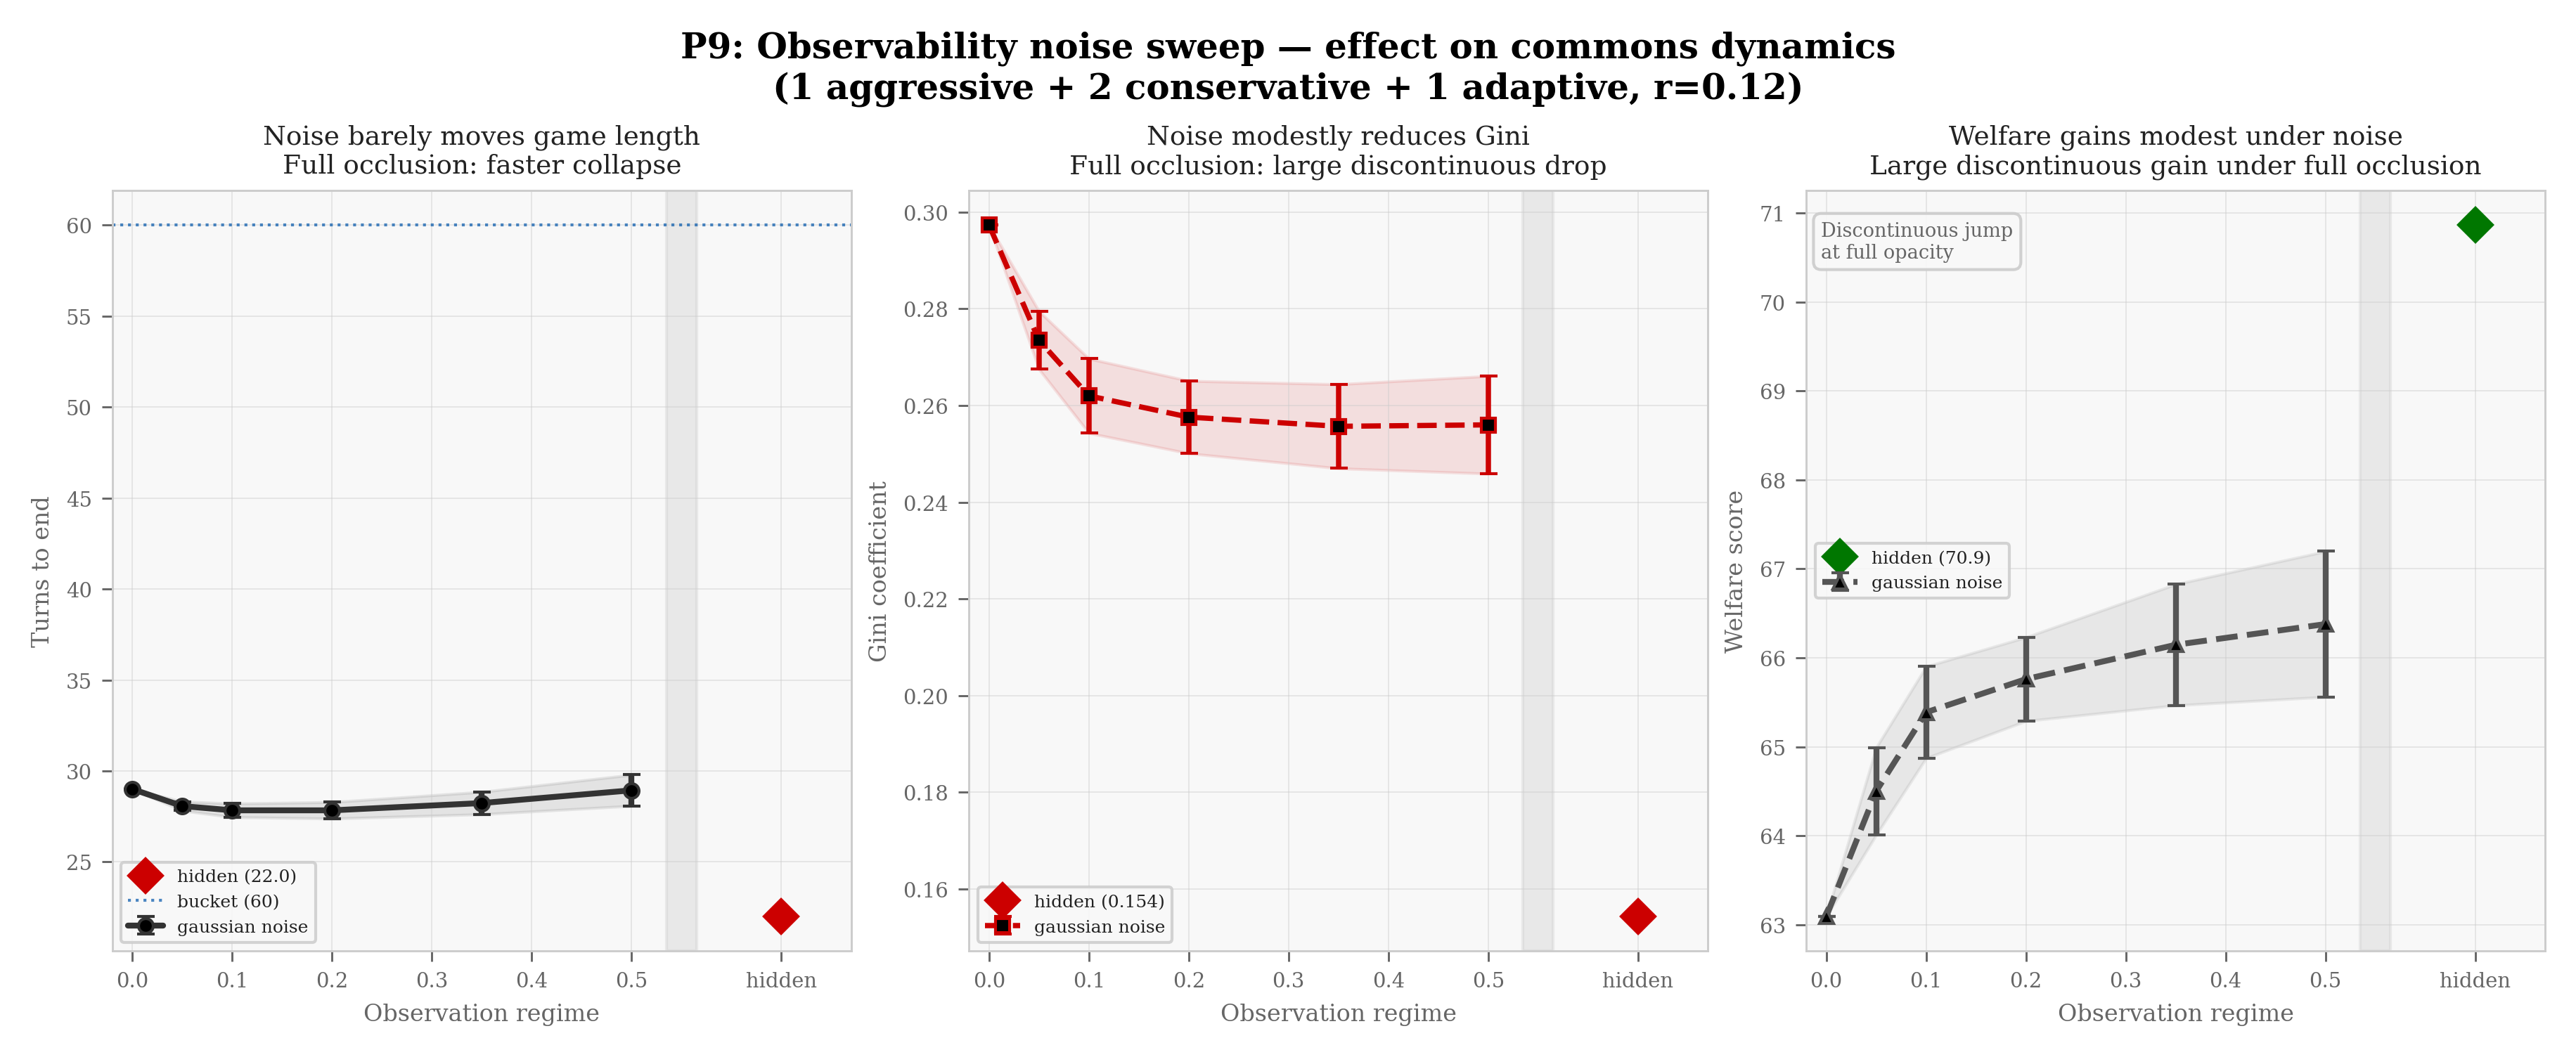
The effect splits cleanly into two regimes (Figure 3.15). Across the noisy range, welfare rises modestly from 63.0 (no noise) to 66.4 (50% noise) — a 5% gain — while Gini drops from 0.298 to 0.256 and game length stays essentially flat at 28–29 turns. Full occlusion produces a discontinuous further improvement: welfare jumps to 70.9 (another 7% gain), Gini drops to 0.154 (a further 40% drop), and collapse arrives 6 turns earlier (22 turns) — a single qualitative shift of comparable magnitude to the entire continuous noise range. The mechanism behind the two regimes is the same asymmetric blunting, expressed at different magnitudes. Across the noisy range, the aggressive agent underestimates available stock and dampens extraction, while conservative agents — whose strategy does not condition on stock observation — are unaffected; the welfare gain is small because the aggressive agent’s estimation error averages out across runs. Full occlusion is the qualitative limit: with no signal at all, the aggressive agent loses its stock-sensitive advantage entirely, every agent defaults to its capacity-bound nominal fraction, and extraction is distributed almost uniformly. This is the most equitable outcome of the sweep, but also the shortest: with all agents extracting at fixed rates, the commons collapses in 22 turns rather than the 28–29 typical of the noisy points.1 Welfare rises despite the earlier collapse because the gain in equity outweighs the loss of mean wealth. The result extends Ostrom’s design Principle 4 on monitoring (Ostrom 1990) in a direction her case studies did not test: where she documented that accountable monitors stabilise long-enduring CPR institutions, our sweep shows that — for agents whose strategy conditions on the stock signal — coarsened or absent monitoring also improves welfare, by disabling fine-tuned free-riding. The two findings are complementary rather than identical: hers is about the social function of imperfect but functional monitoring; ours is about a mechanism by which imperfect monitoring dampens strategic exploitation when agents are heterogeneous in signal-use.
3.4.1 CT3 — Observability Noise: A Structural Null for Random-Selection Agents
Directly mirroring the platform’s observability sweep (P9), we added Gaussian noise to the reported Forest Deck size at levels \(\sigma/\mu \in \{0.0, 0.1, 0.2, 0.3, 0.4, 0.5\}\) plus a full-occlusion condition (“hidden”), in a Warrior-King vs. Temple Keeper matchup (9 rounds, 200 games per point).
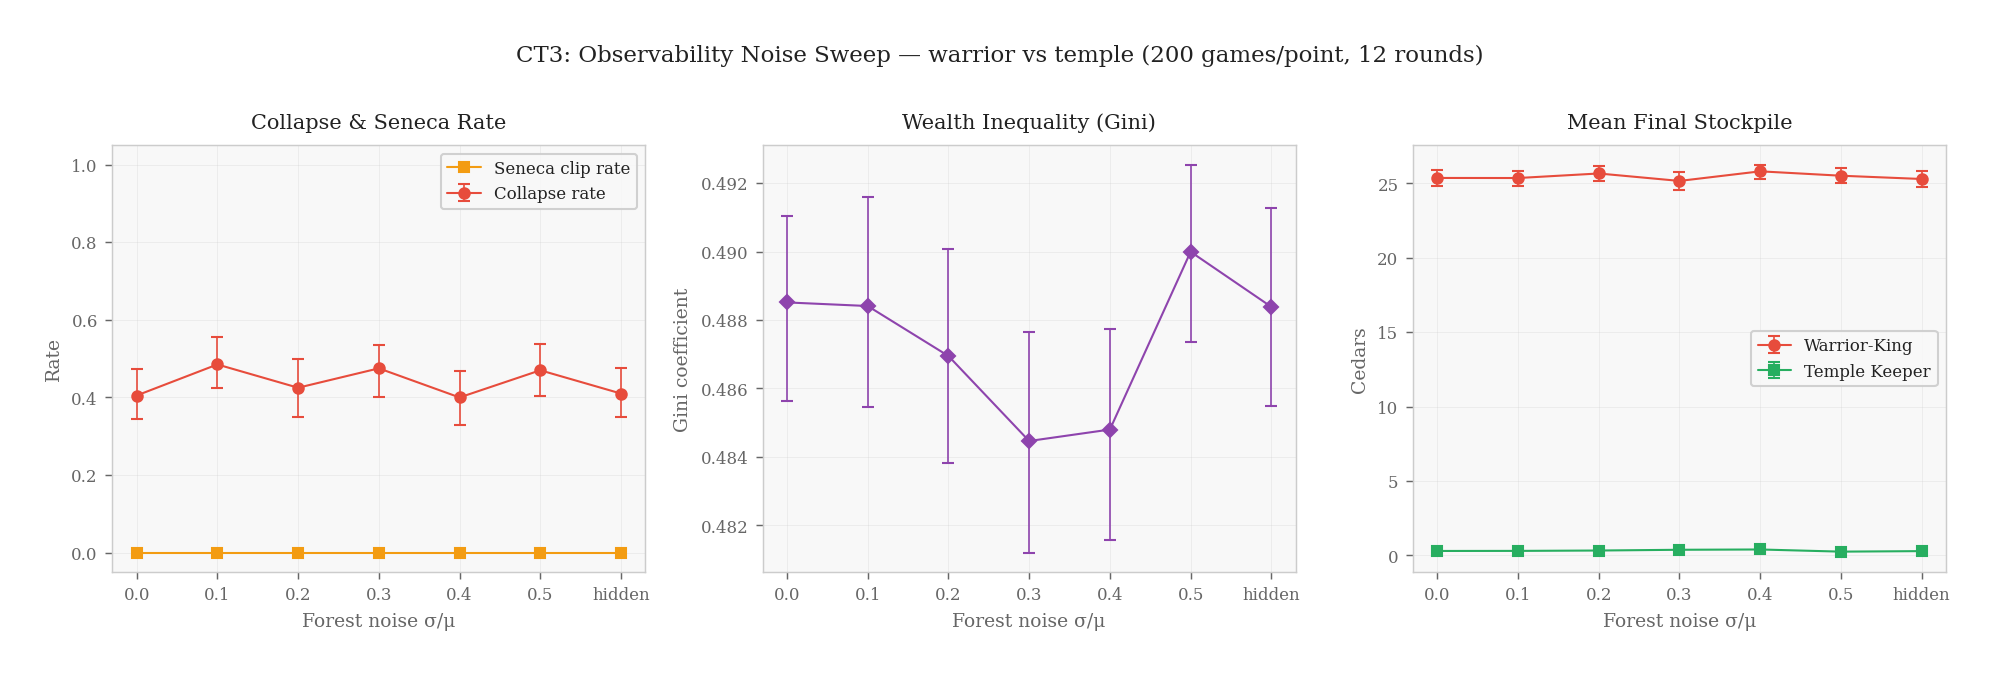
This result (Figure 3.16) is expected by construction: in demo mode, both archetypes select cards uniformly at random within their decks, so extraction and healing emerge entirely from deck composition, not from any decision logic that reads observed stock. The zero effect of noise is therefore a design sanity check, not a discovery. The substantive RQ3 finding sits in P9: even simple heuristic Arena agents are affected by noise, precisely because they do condition on the stock signal — however crudely. The P9 vs. CT3 divergence isolates the operative mechanism: noise matters only when agents possess the architecture to act on stock signals (Simon 1955; Gigerenzer and Gaissmaier 2011), and the card game’s null result is the cleanest possible structural confirmation.
3.5 Temporal Dynamics: Exogenous Shocks and Endogenous Betrayal (RQ4)
The final two experiments investigate the possible presence of temporal asymmetries in commons dynamics, of which the Seneca effect would be an example due to the feedback loop in resource dynamics. Together, these experiments demonstrate that strategic behaviour alone on a symmetric logistic baseline does not generate the Seneca cliff: true structural asymmetry in collapse dynamics requires the capital-pollution feedback loops formalised in the Bardi ODE, deferred to future work.
P10 — Perturbation: regen shock. A regeneration shock was applied at turn 20: the regen rate was multiplied by a factor \(f \in \{0.10, 0.25, 0.50, 0.75, 1.50, 2.00\}\) (no shock = f = 1.0 baseline, r = 0.12). Population: 1 aggressive + 2 conservative + 1 reactive. The experiment tests the presence of shock-induced asymmetries: whether negative shocks (f < 1) and positive shocks (f > 1) of equal magnitude produce effects of different size or direction on game length and welfare.
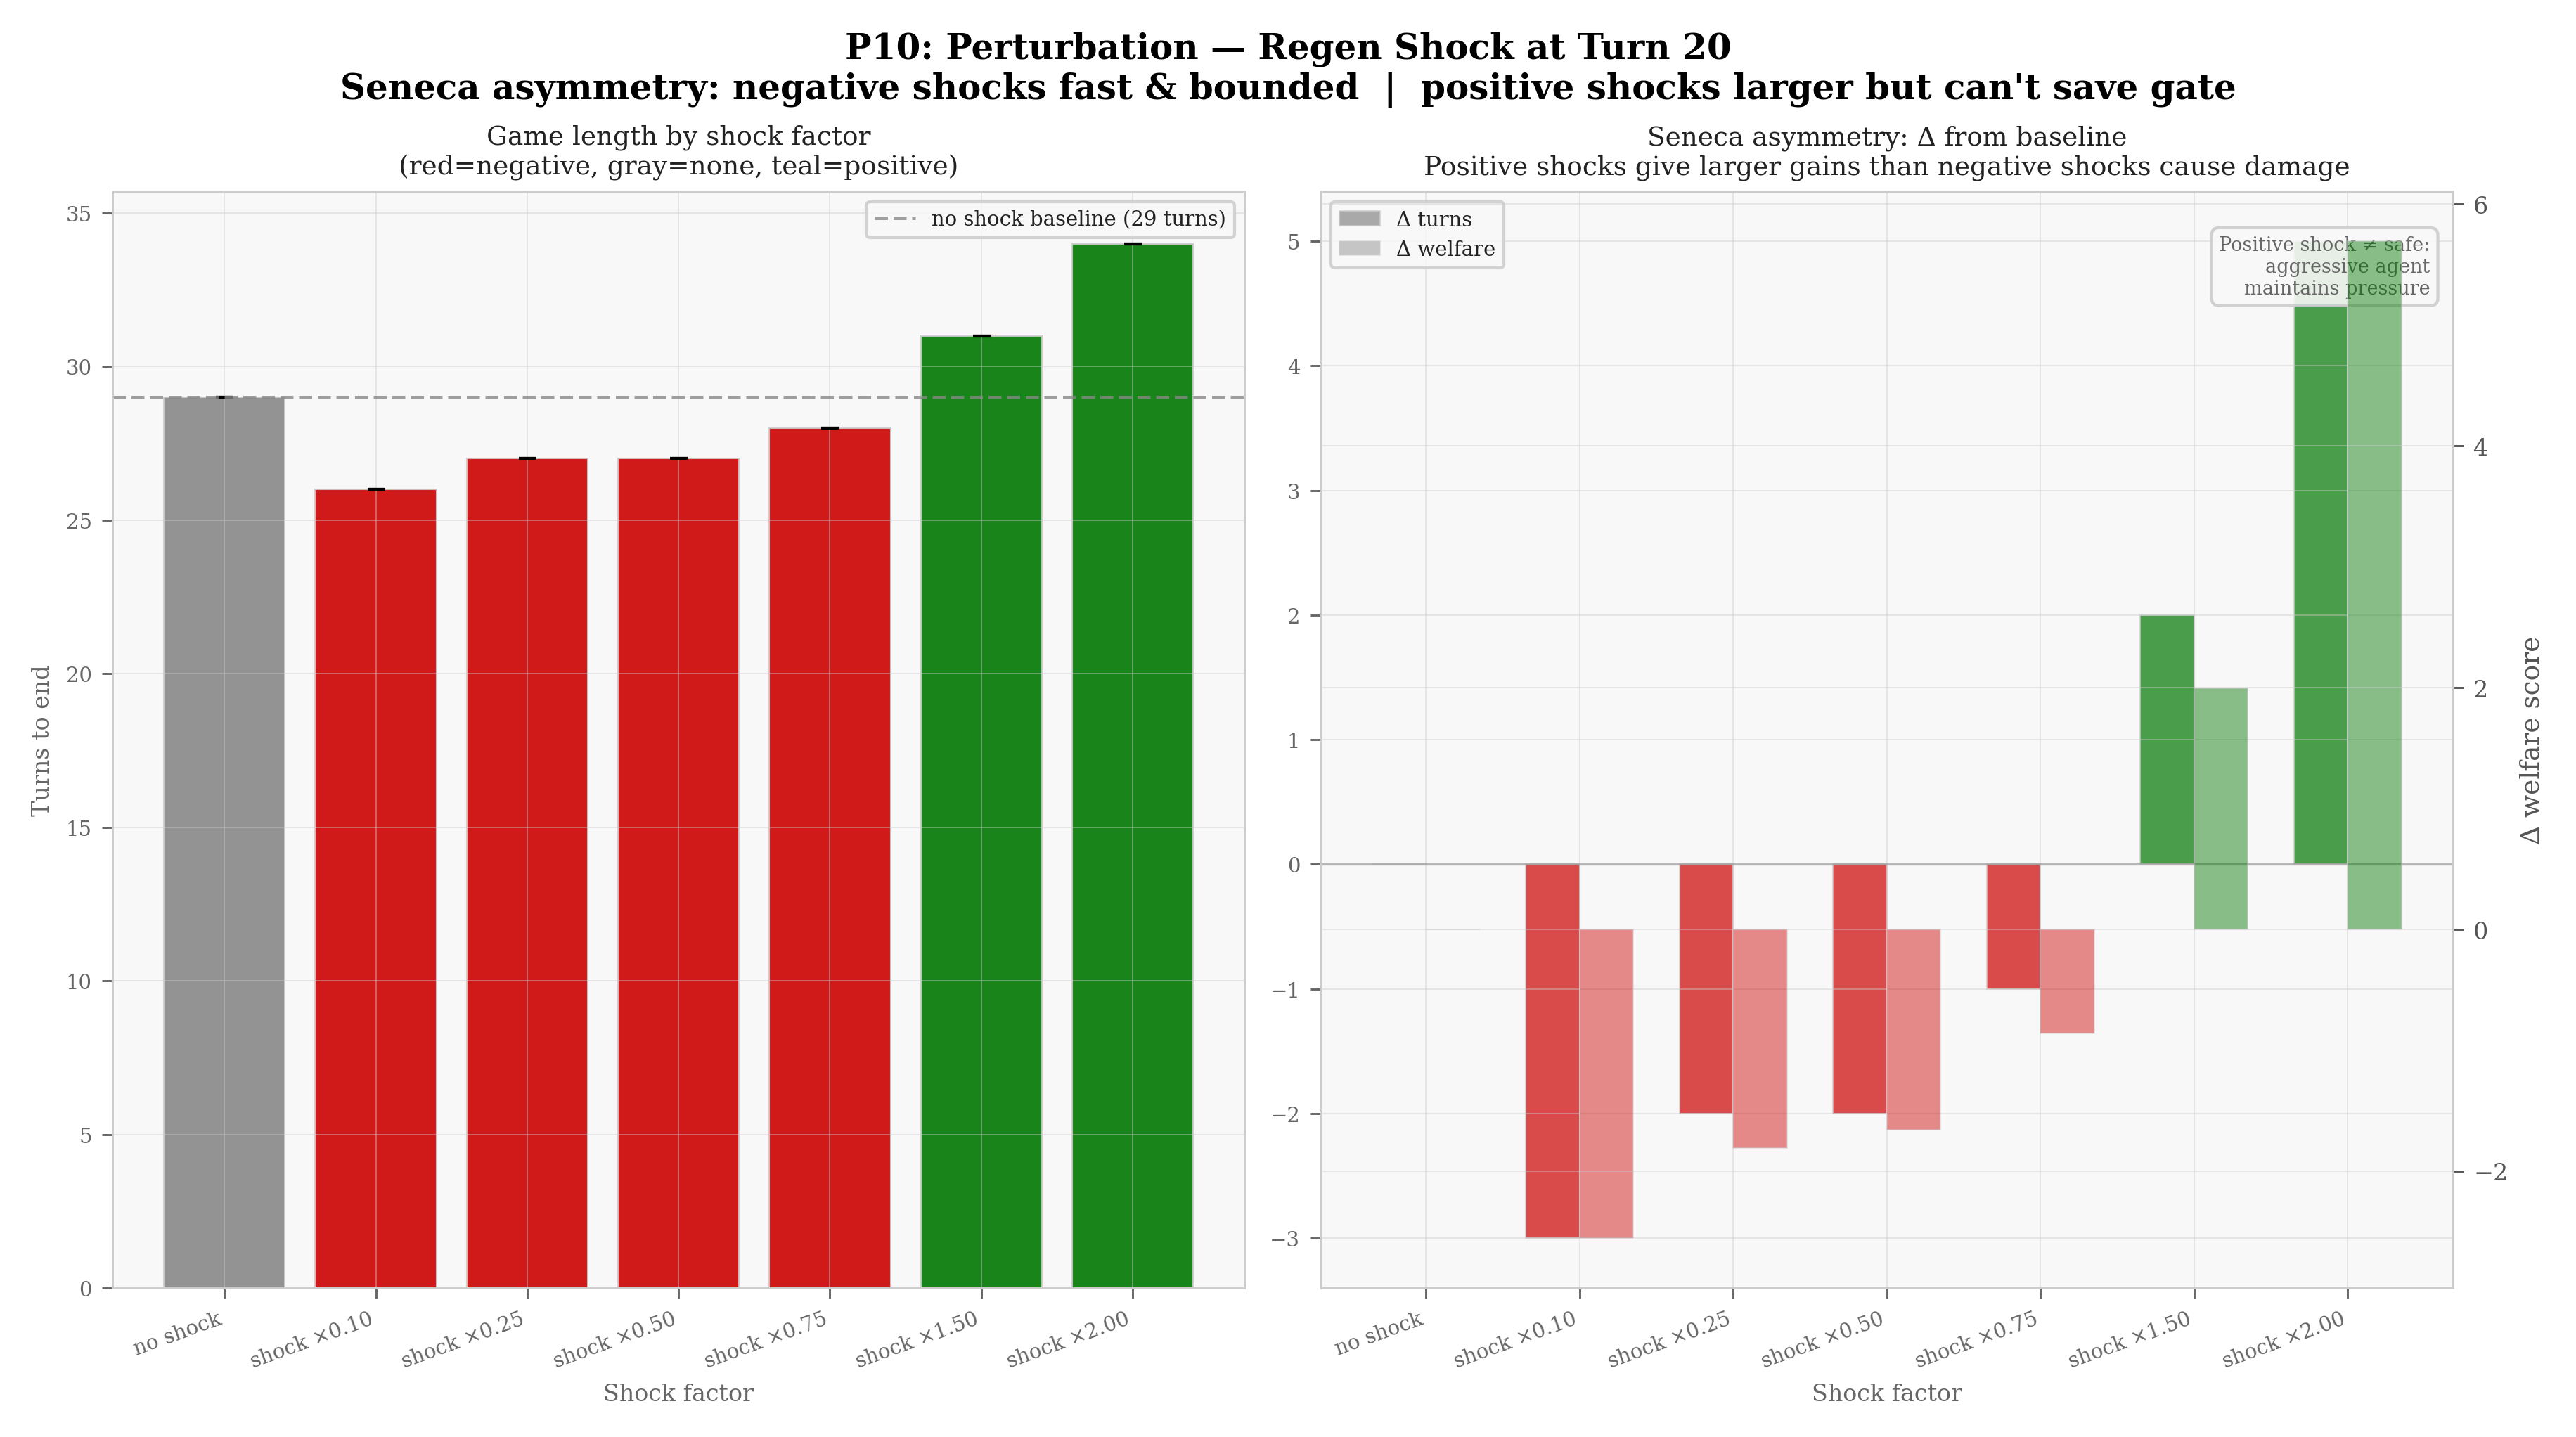
The Seneca asymmetry — in which negative shocks would cause disproportionate damage relative to the relief provided by positive shocks — does not materialise (Figure 3.17). Instead, the reverse pattern holds: the most severe negative shock (-90 % regen, factor $\(0.10) reduces game length by only 3 turns and welfare by 2.6 points relative to the 29-turn baseline, while a matched positive shock (\)$2.0) extends the game by 5 turns and raises welfare by 5.7 points. Positive shocks therefore help more than negative shocks hurt.
The mechanism is strategic, not structural. By turn 20 the aggressive agent has already committed the commons to its depletion trajectory, so a negative shock merely accelerates a collapse that was already inevitable — its marginal damage is bounded. A positive shock, by contrast, adds regeneration that compounds over the remaining turns before inevitable collapse, extending game length and welfare accumulation. Supplement B4 (Appendix B) isolates the pure resource component by removing the aggressive agent entirely: without strategic pre-depletion, negative shocks must fall below factor $$0.25 to trigger collapse at all, and welfare responses to matched positive and negative shocks are nearly symmetric. The inverted asymmetry of P10 is therefore an artefact of the strategic state of the system at the moment the shock arrives, not of the logistic model itself. Gate passage remains at 0 % for all shock magnitudes.
P11 — Mule: strategy override timing. An initially cooperative agent (conservative strategy) was switched to aggressive at a programmatically controlled defection turn \(T \in \{5, 15, 25, 35, 45\}\) (step 10), in a 4-agent pool (1 mule + 3 conservative, \(r = 0.14\), maxTurns = 60). The regeneration rate \(r = 0.14\) sits inside the empirically realistic slow-regeneration band (\(r \le 0.32\)), and is the same value used as the discriminating slow-regime anchor in the B2 welfare-slope regression that reports \(\Delta W \approx -16.17\) at this rate (Table C.1): re-using it here keeps the late-defection experiment commensurable with the rest of the slow-regime sweeps. The baseline (no defection, all four agents cooperative throughout) was also run. The experiment tests whether there exists a safe defection timing — a turn late enough that the commons has been sufficiently preserved, and early enough that the defector can still accumulate wealth before the game ends — and characterises the structural fragility of cooperative equilibria to a single strategic defector.
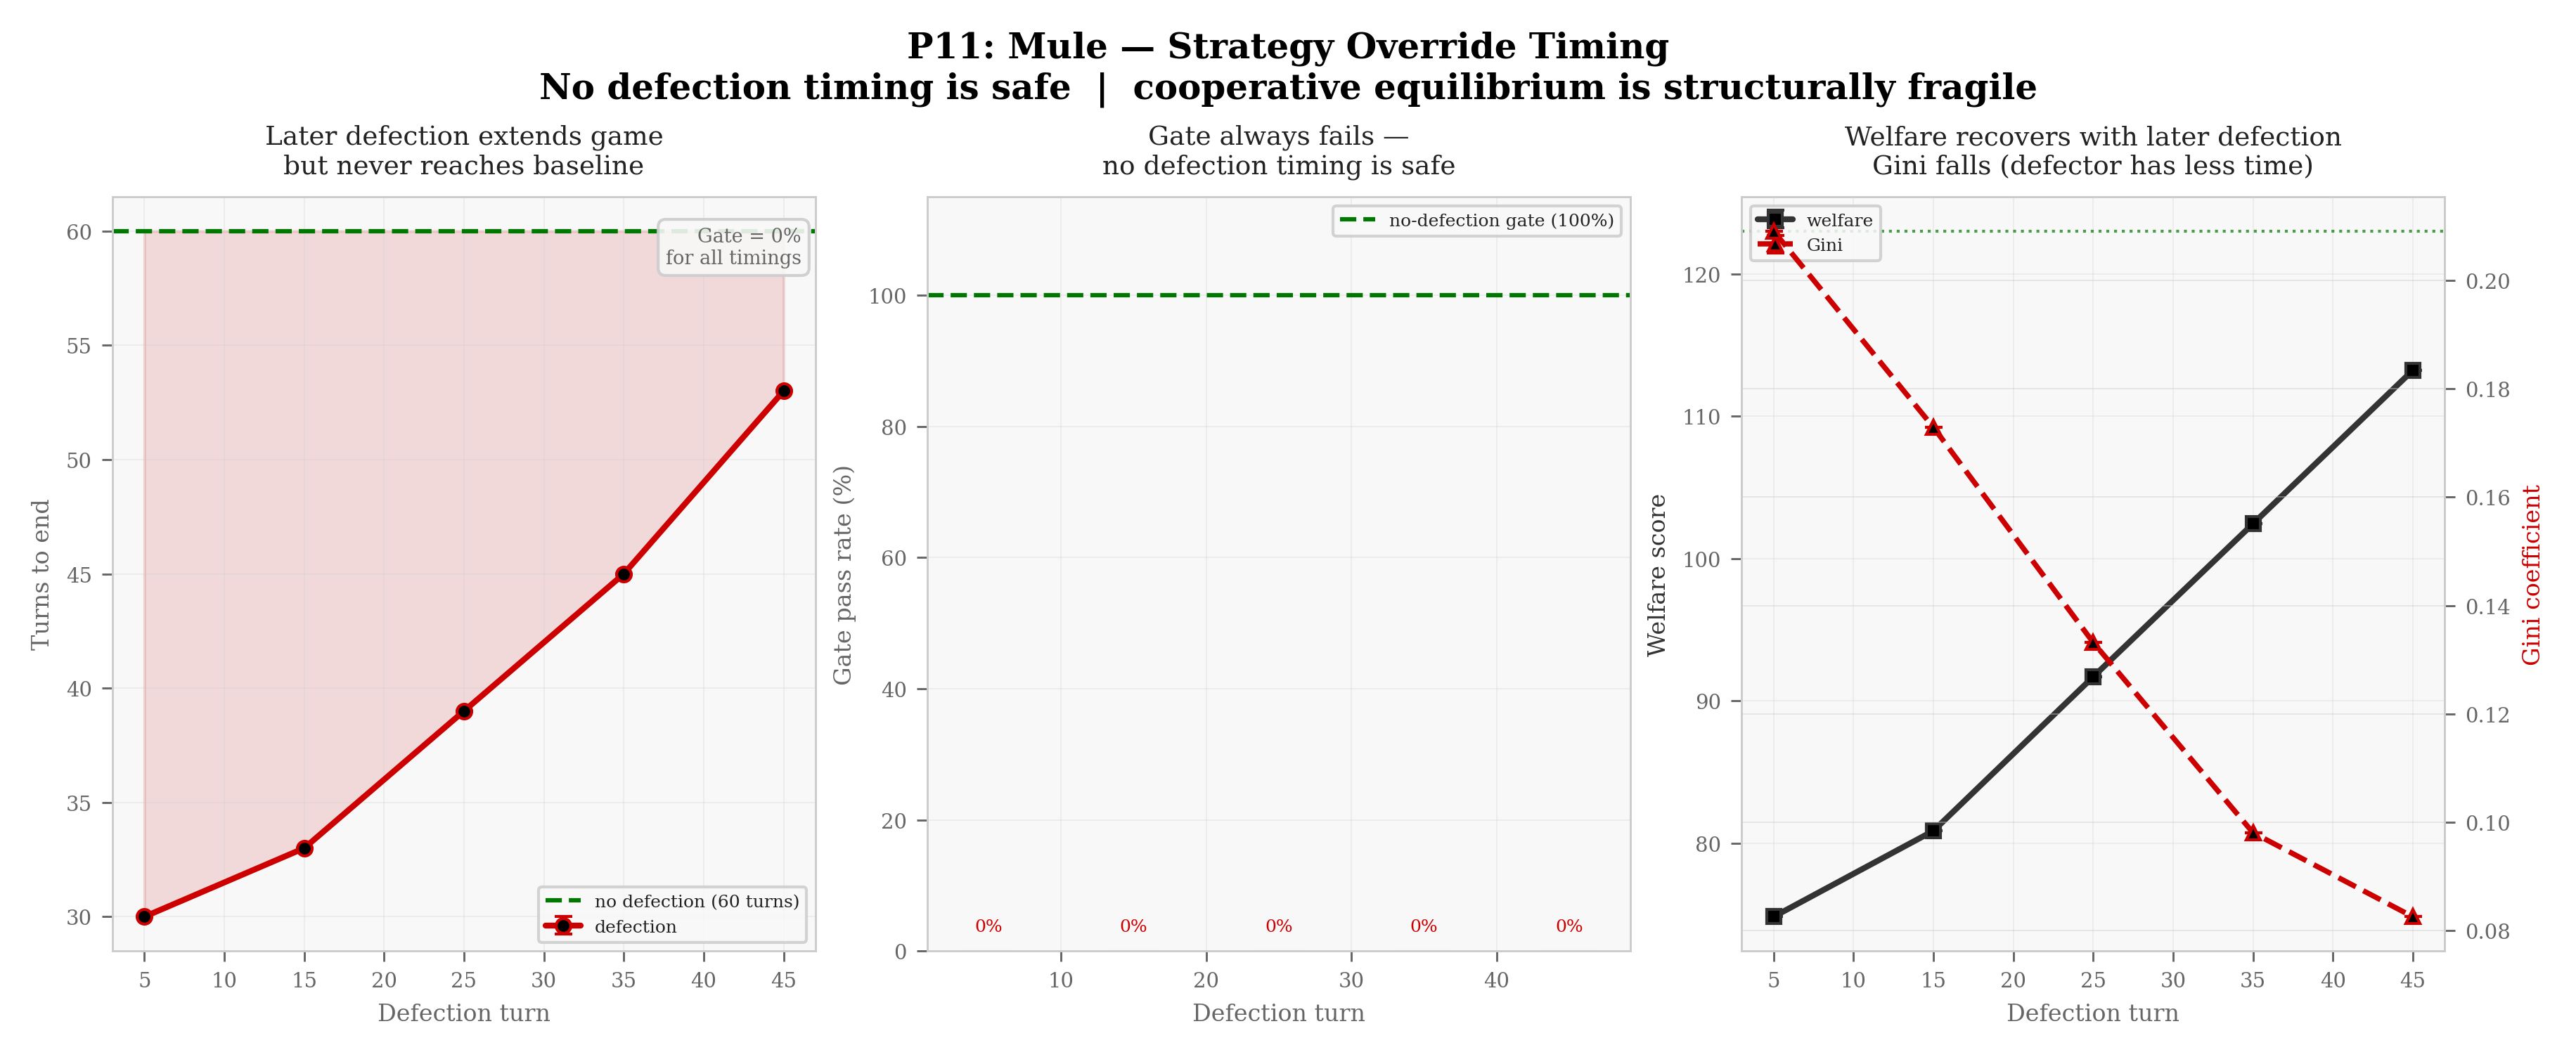
Even a defection at turn 45 — after 45 turns of fully cooperative play — prevents gate passage (Figure 3.18). This result is striking because the no-defection baseline (all four agents conservative throughout) sustains the commons to completion: gate = 100%, turns = 60, welfare = 123.01. The Mule experiment therefore does not describe a system already condemned — it describes one that is perfectly healthy and becomes irreversibly fragile the moment a single agent defects. No defection timing is safe: even the briefest aggressive window (T = 45 leaves only 15 turns of aggression) prevents gate passage. Welfare rises monotonically with later defection — from 74.83 at T = 5 to 113.22 at T = 45, against a cooperative baseline of 123.01 — as the shorter aggressive window extracts less before game end, but still falls short of the fully cooperative equilibrium. Gini declines symmetrically. The arithmetic is striking: a 15-turn aggressive window (25 % of game length) suffices to undo 45 turns of fully cooperative play (75 %), confirming that ecological surplus accumulates more slowly than it can be extracted. The “bank” of resilience built by prior cooperation is therefore not an insurance against late defection but an inviting target. These confirm that cooperative equilibria are structurally fragile to a single strategic defector: even a brief burst of aggressive extraction depletes ecological surplus faster than any prior cooperative phase can accumulate it.
3.5.1 CT4 — Defection Timing: Safe Betrayal Against Conservators
The platform’s Mule sweep (P11) tests the fragility of cooperative equilibria to late defection. We replicate this with the Stranger-King deck, sweeping the forced defection turn from 3 to 11 in two matchups: Stranger-King vs. Temple Keeper (low baseline pressure) and Stranger-King vs. Warrior-King (high baseline pressure), using 12 rounds and 200 games per point.
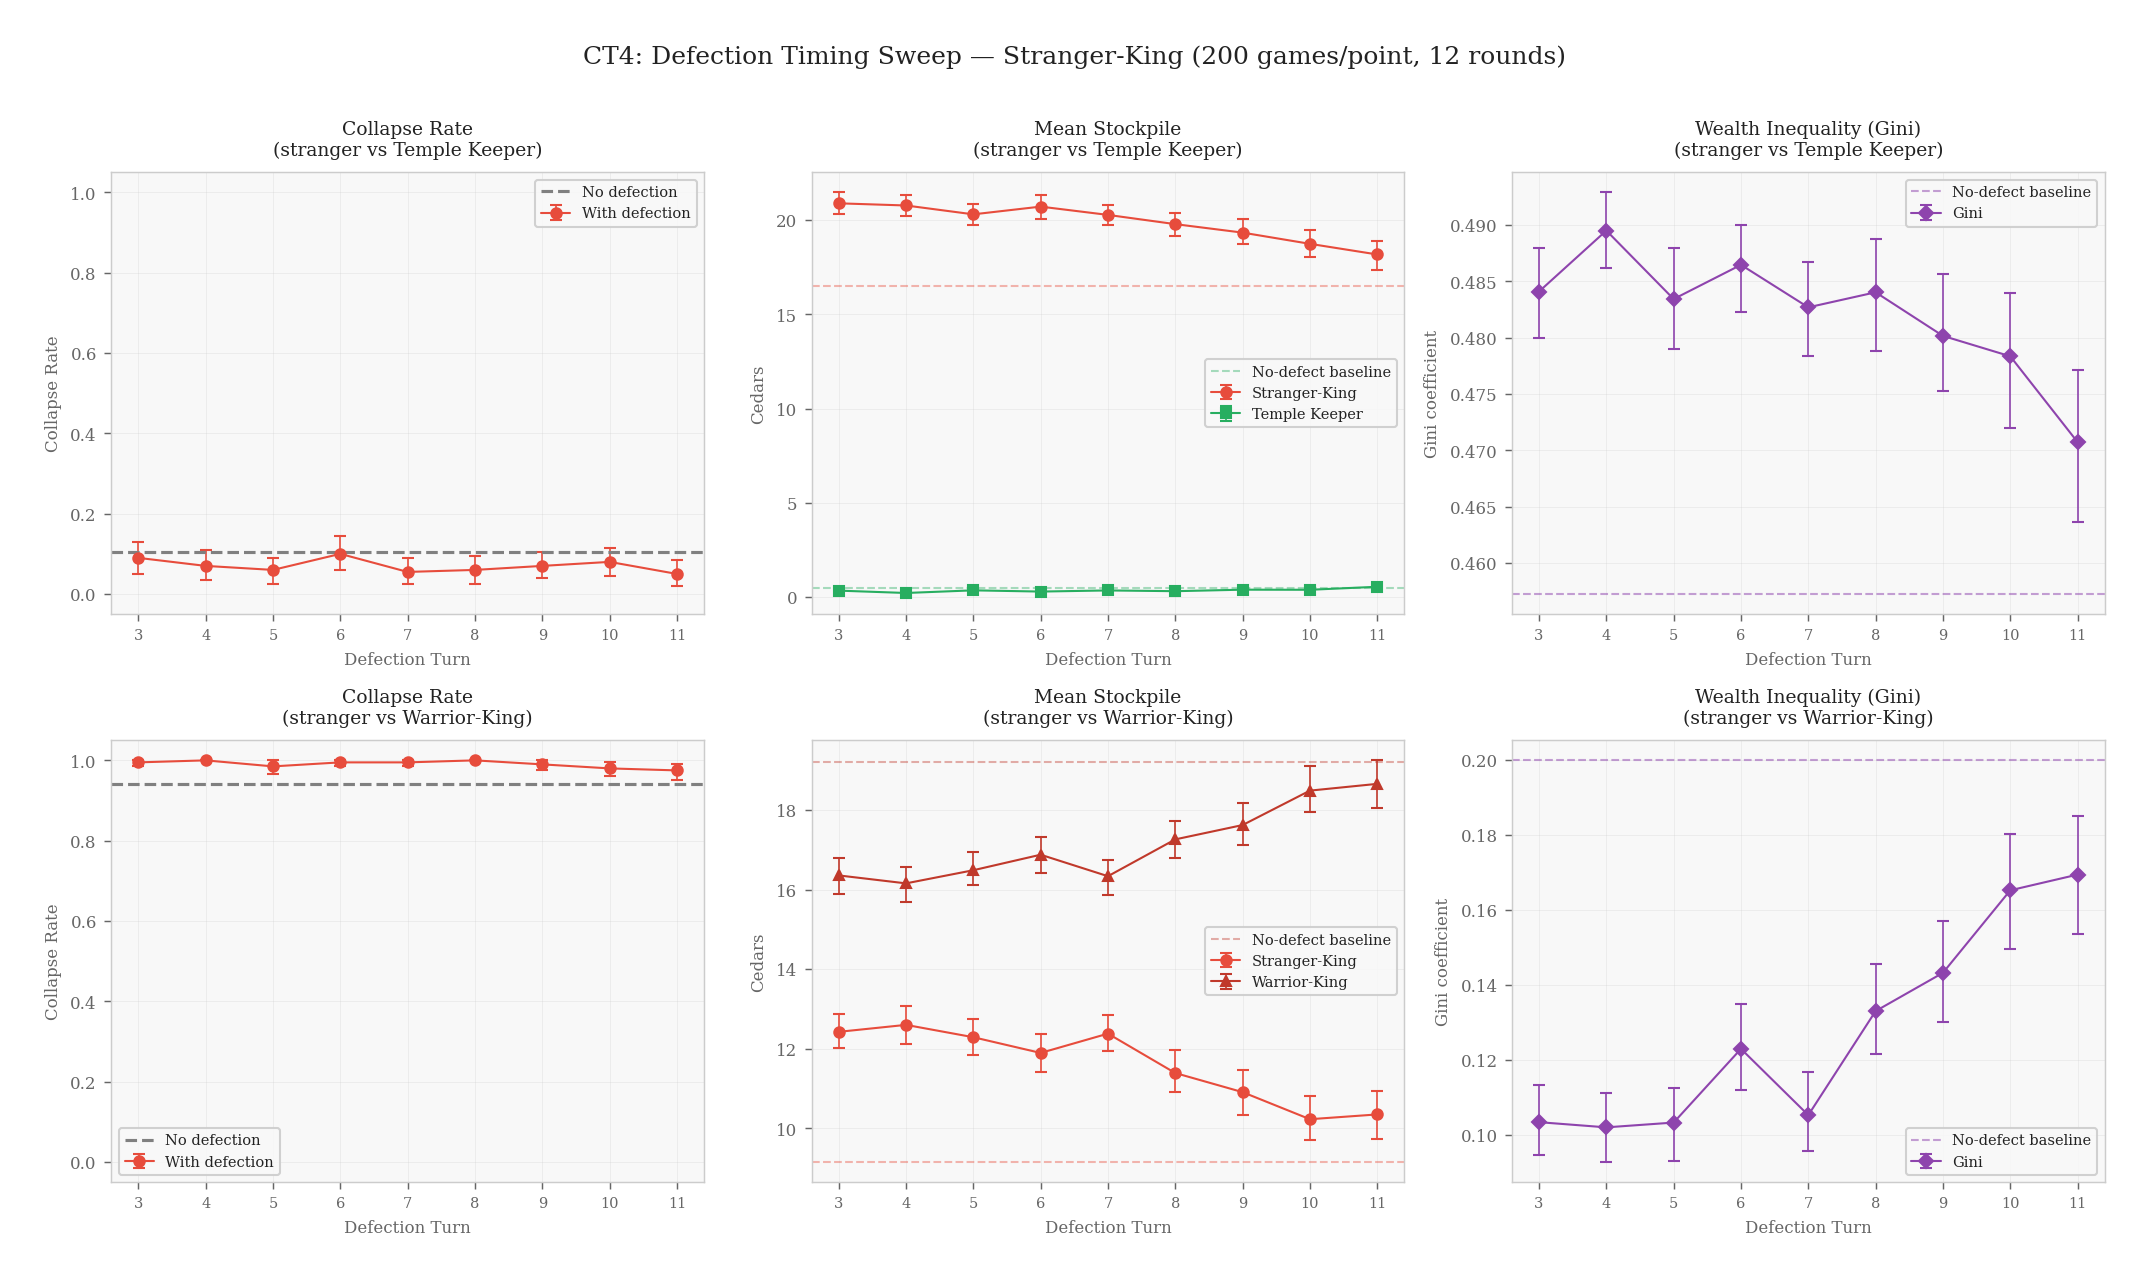
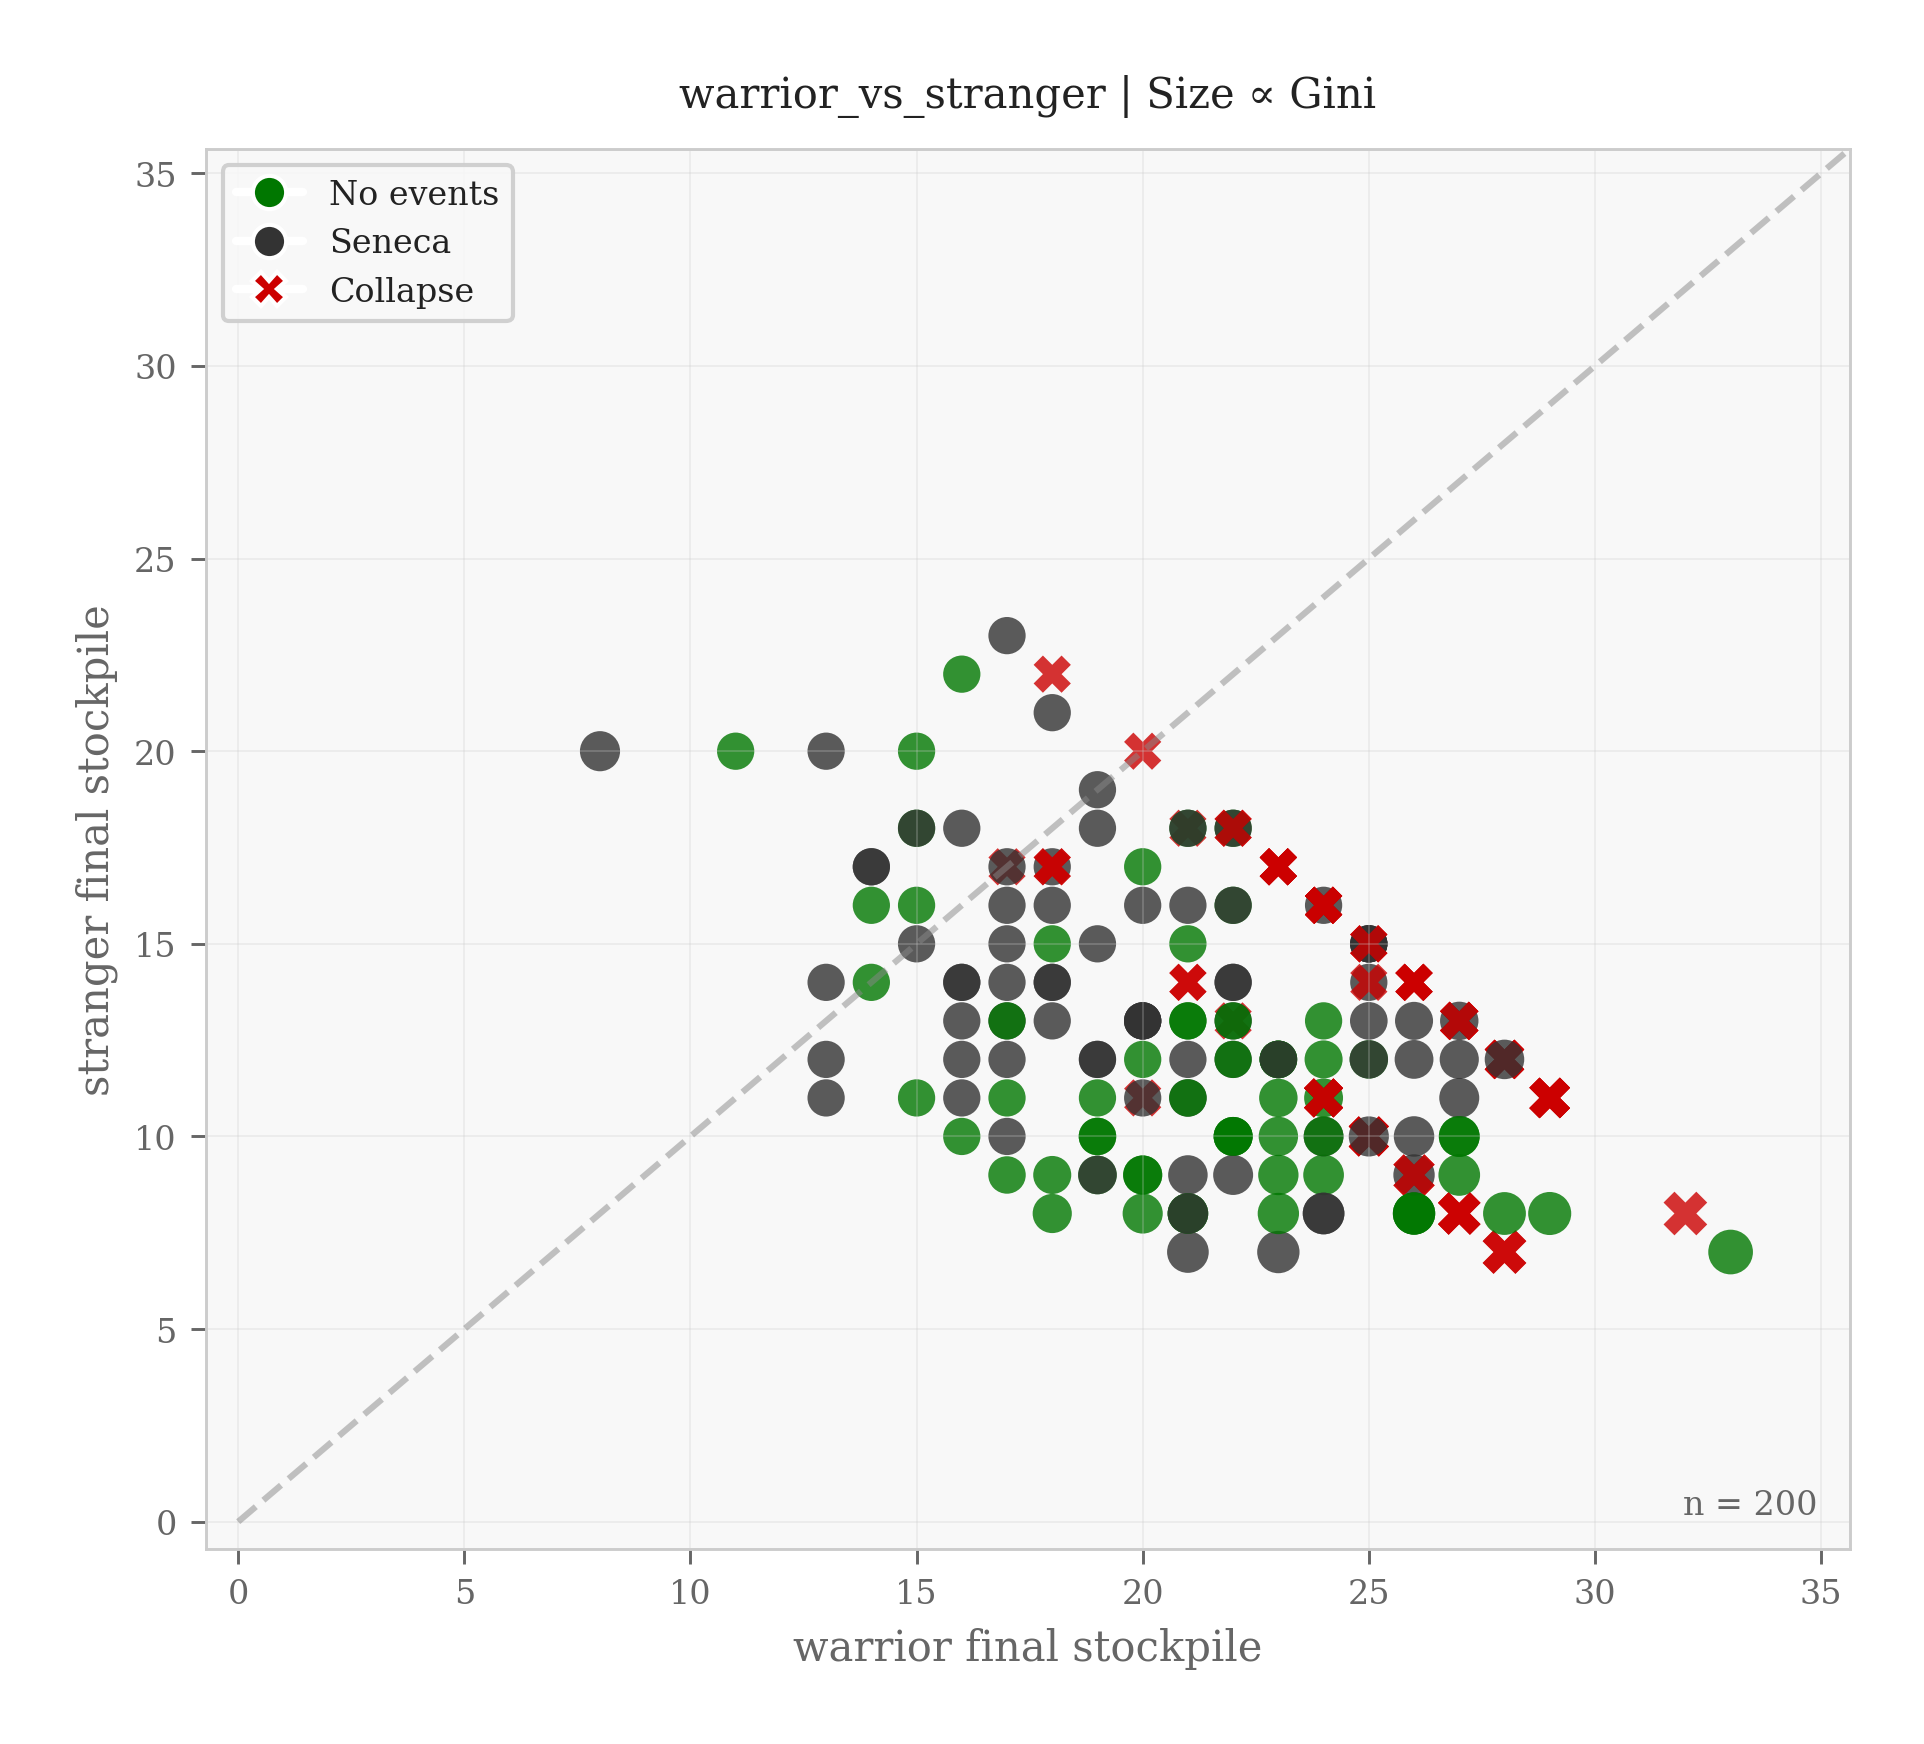
The card game reveals a phenomenon absent from the Arena: safe betrayal (Figure 3.19, top row). Against the Temple Keeper, defection is not only profitable but mildly protective of the commons — counterintuitively reducing the collapse rate below the no-defection baseline. The Temple Keeper’s continuous healing creates a resource surplus that absorbs even bounded aggressive bursts; the Stranger-King’s defection — mandatory at Round 7 if not chosen voluntarily from Round 3, and itself a stochastic draw once DEFECT NOW enters the valid-card pool — creates a single bounded extraction window that avoids the slow drip of an unconstrained aggressive policy.
The contrast in extraction structure clarifies why. The Warrior-King extracts aggressively on every one of the 12 rounds (a constant drain across the whole game). The no-defection Stranger-King draws randomly from its cooperative deck for all 12 rounds, producing a similarly diffuse pattern of uncontrolled extraction. A defecting Stranger-King, by contrast, plays gently for turns 1 through \(T-1\) and concentrates all aggression into the single block from turn \(T\) to Round 12. Because the Temple Keeper heals the forest every turn regardless, the quiet pre-defection turns give it a head start; when the burst arrives it is intense but finite, and a continuous healer can absorb a concentrated burst more easily than twelve rounds of unrelenting extraction.
Early defection is most profitable because it maximises the number of post-defection aggressive rounds: stockpile declines on average from 20.90 cedars at \(T=3\) to 18.18 at \(T=11\), against a no-defection baseline of 16.51. Against the Warrior-King the situation reverses (Figure 3.19, bottom row): the commons is already under severe pressure, and any defection pushes a near-certain collapse to certainty.
3.5.2 CT5 — Stranger-King Deep Dive
We conducted three complementary sub-sweeps on the Stranger-King deck (vs. Warrior-King, 12 rounds, 200 games per point) to investigate the mechanics of delayed defection in a high-pressure environment.
CT5a — Patience accumulated at defection. We recorded the mean Patience tokens held by the Stranger-King at the moment of forced defection across turns 3–11.
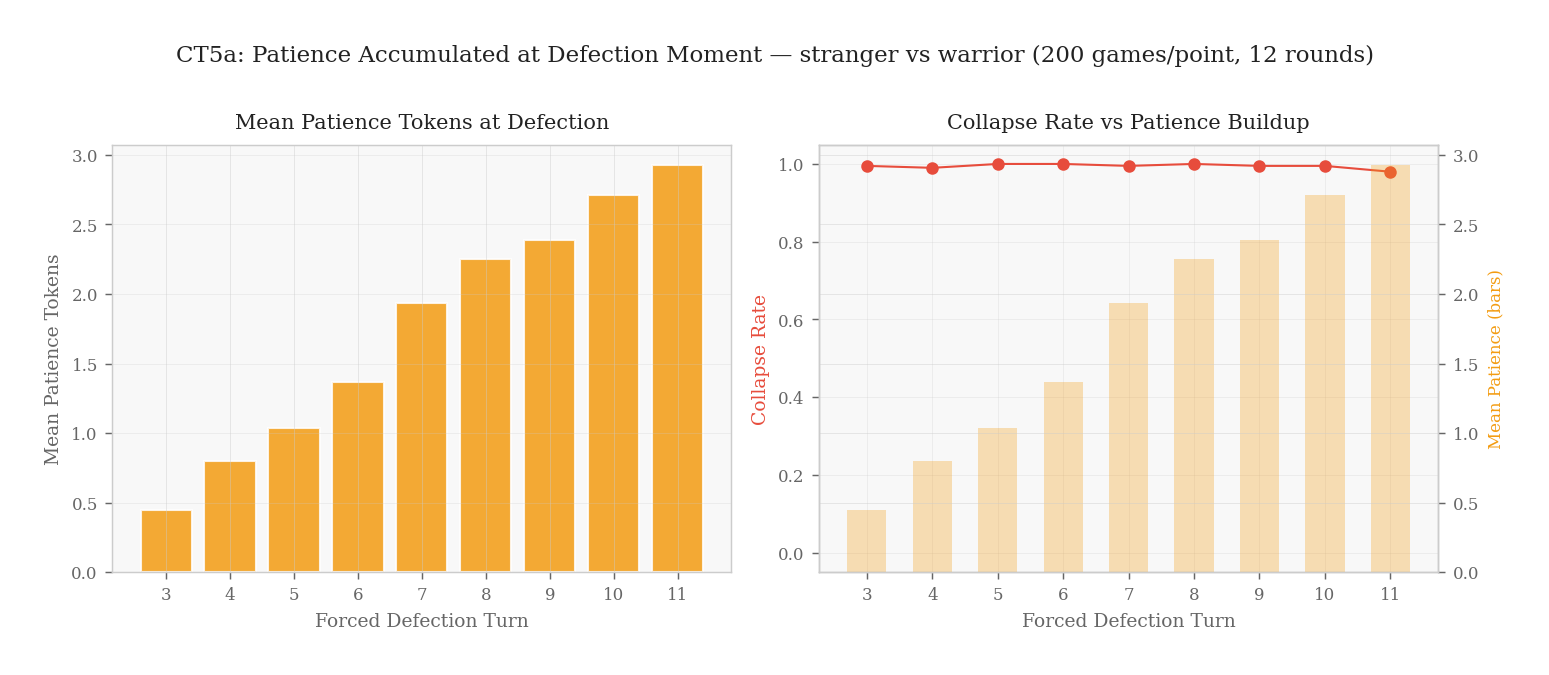
Patience accumulates linearly with cooperative turns but translates into no survival benefit when facing the Warrior-King (Figure 3.20). The mechanism is structural: the Warrior’s extraction rate depletes the Forest Deck before the Stranger-King’s burst can matter. This heuristic result is replicated at statistical scale with DeepSeek v4-flash in Section B.8.1: all games collapse (100%) with no game surviving past T=7 against a Warrior-King, and patience grows at ~0.43 tokens/turn regardless of LLM strategy — confirming that the draw-pile constraint, not cognitive architecture, governs accumulation.
CT5b — Aggression nudge strength. We swept the --aggression nudge parameter from 0.8 to 2.0, testing whether the intensity of the language-mediated behavioural nudge alters outcomes.
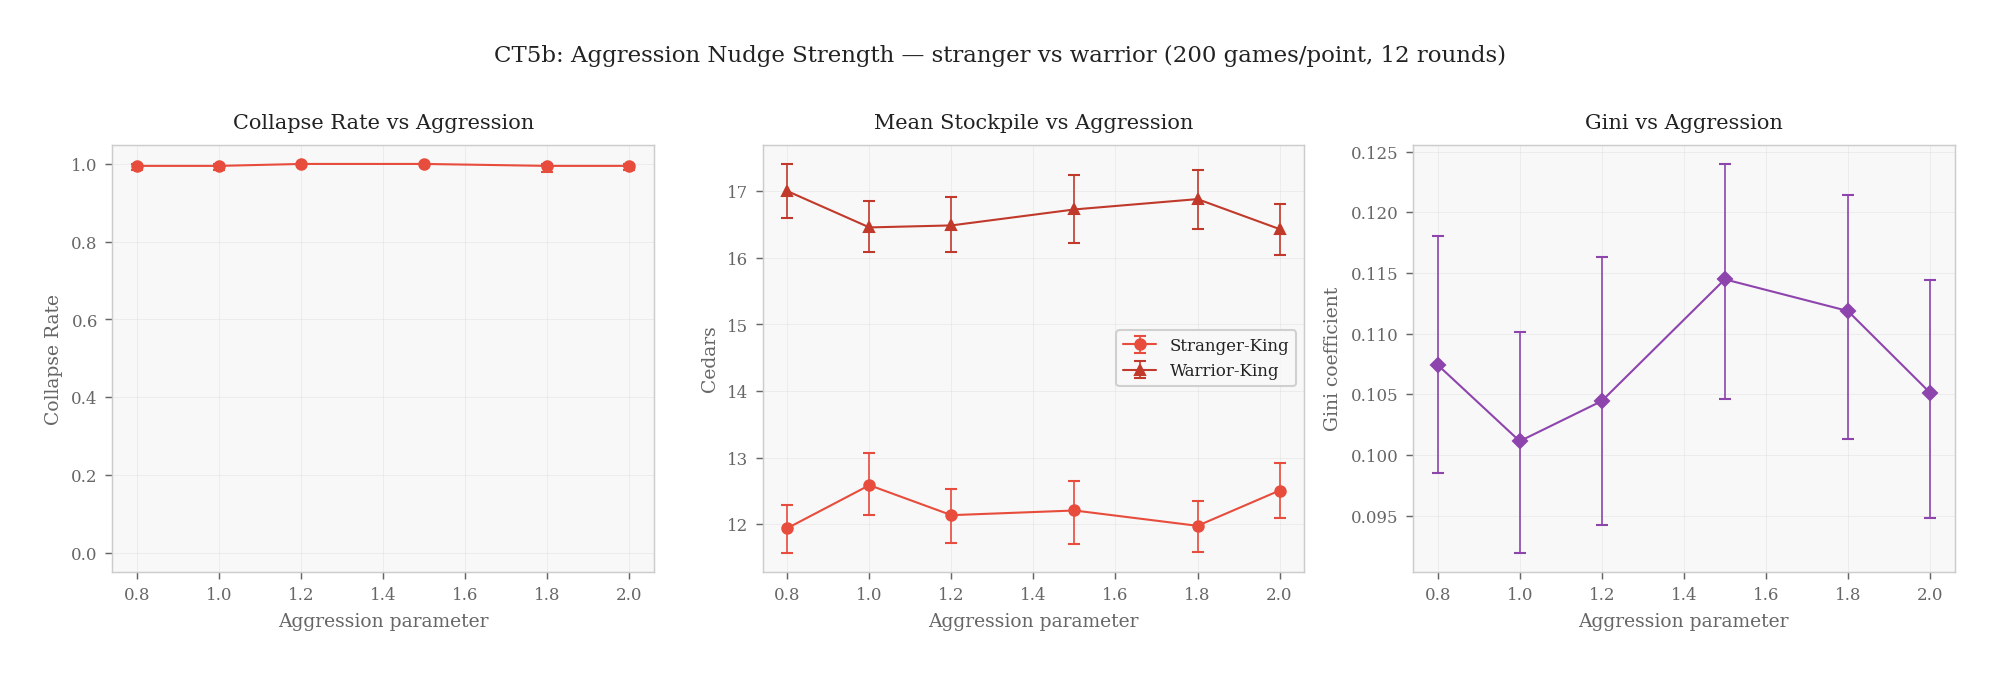
The nudge has no measurable effect (Figure 3.21) — a result that is expected by construction: --aggression is an LLM-only parameter (see Table B.1) and CT5 runs in demo mode, where archetypes draw cards uniformly at random with no prompt to nudge. CT5b therefore functions as a sanity check rather than an empirical finding: it confirms that --aggression does not leak into the demo-mode code path — the null result in CT5a and CT5c is not contaminated by unintended coupling between the LLM and demo branches. The substantive question of how burst strength affects the Stranger-King’s relative performance is addressed in Section B.8.1 (Appendix), where a complementary sweep with DeepSeek v4-flash varies the Patience burst multiplier directly (0.8\(\times\)–2.0\(\times\)) and finds a non-monotonic optimum at 1.5\(\times\): the SK/WK stockpile ratio peaks at 0.852, compared to 0.628 at the default 1.0\(\times\), with further increases accelerating collapse before the surplus can be harvested. Whether language-mediated nudges can override structural strategic pressure in a high-pressure matchup is addressed qualitatively in CT6.
CT5c — Hand composition at defection. We recorded the Stranger-King’s hand size and aggressive harvest potential at the moment of defection across turns 3–11.
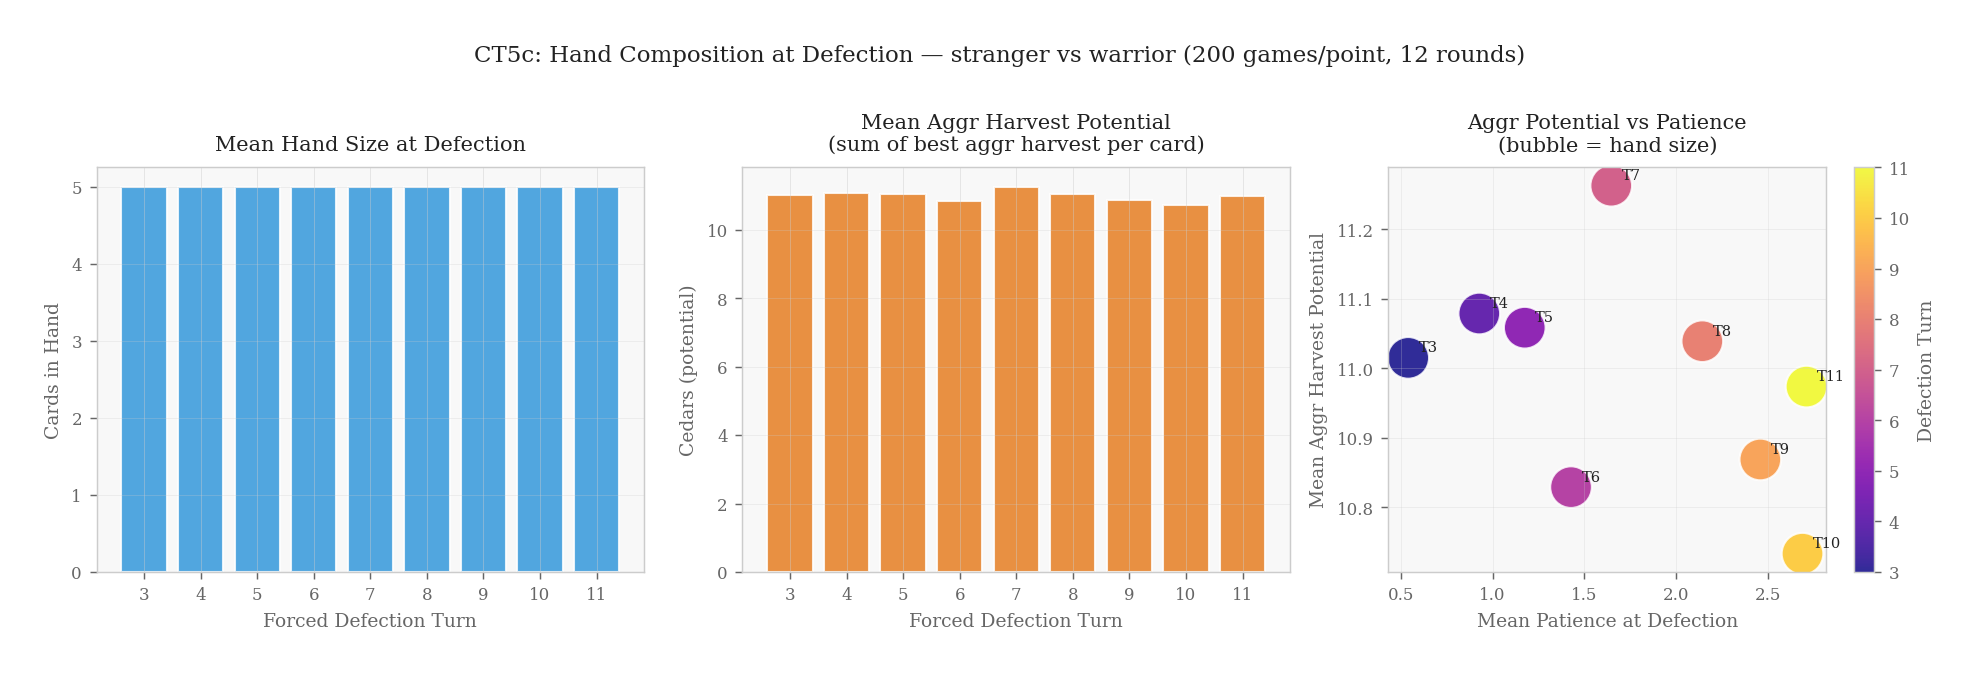
Hand composition is stable: the Stranger-King consistently holds 5 cards with ~11 cedars of aggressive potential regardless of when it defects (Figure 3.22). The constraint on safe betrayal against the Warrior-King is not the Stranger-King’s readiness — it is the commons’ prior depletion.
3.5.3 CT6 — LLM Agent Qualitative Case Studies (Preliminary)
As a preliminary, single-model investigation into generative agent behaviour (Park et al. 2023), we conducted case studies with DeepSeek v4-flash playing the Stranger-King role against both Temple Keeper and Warrior-King opponents (details in Section B.8.1; full case-study narrative in Section B.8).
CT6a — Qualitative case study. Three observations emerged. First, the LLM consistently betrayed early — typically within one turn of the forest reaching maximum health — spontaneously reproducing the safe betrayal dynamic observed in CT4, without explicit instruction. Second, against the Warrior-King, the LLM exhibited what we term awareness-without-restraint (on the basis of this single-model case study): its chain-of-thought reasoning identified imminent forest collapse, yet it continued to extract aggressively. Institutional rules failed to translate cognitive awareness into behavioural restraint. Third, defection timing proved irrelevant against the Temple Keeper (21 vs. 20 cedars), confirming that the compensator absorbs aggression regardless of timing.
CT6b — Parametric sweep (20 games). A follow-up sweep revealed that the LLM accumulated 25.6 cedars without defecting — nearly identical to defection outcomes (24.6–26.2) — suggesting that its nominal cooperation is functionally aggressive. This confirms that deck composition constrains outcomes more than the LLM’s stated strategy: the Warrior-King cards impose aggressive extraction regardless of the agent’s cooperative reasoning, a structural parallel to Ostrom’s (1990) finding that formal rules matter more than stated intent. Systematic multi-model validation — across architectures, temperatures, and turn horizons — remains future work (see §4 “What’s Next” and Appendix B).
The numbers reported here for the hidden condition reflect the v1.1 bugfix to
ConservativeAgentandAdaptiveAgent: under hidden-stock observability prior to v1.1, both agents fell back to a zero-harvest no-op via acommonsStock ?? 0clamp inside their decision rule, which silently turned them off rather than letting them default to their capacity-bound nominal fraction. The earlier pre-print version reported Gini = 0.51 and welfare = 45.9 for the hidden point, which corresponded to a single-aggressor-extracts-alone regime; the corrected behaviour distributes extraction across all four agents and is faithful to the intent expressed in the agents’ documentation. The noisy points (\(\sigma/\mu \in \{0.0, 0.05, \dots, 0.5\}\)) are unaffected by the fix because they involve a finite numeric stock observation.↩︎